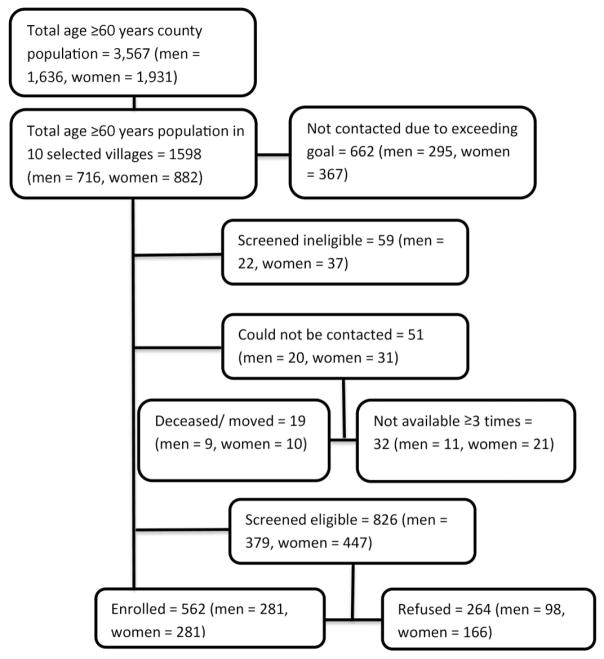
Figure 1.
Flow chart of recruitment for Mobility and Independent Living in Elders Study (MILES). The flow chart shows the total ≥60 years population in the county (n = 3,567) and selected villages (n = 1598) at the time of recruitment. It further shows the number of individuals that were not contacted (n = 662), could not be contacted (n = 51) or were ineligible (n = 59). Then the figure shows the eligible individuals (n = 826) and those who were finally enrolled (n = 562) or refused to take part in the study (n = 264).

