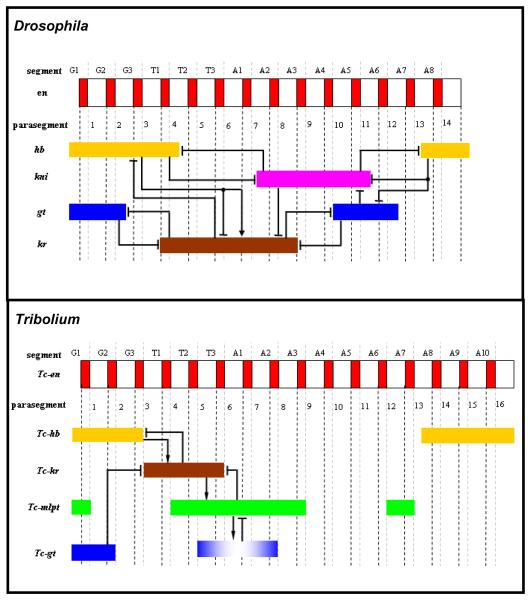
Figure 3. Comparison of gap gene expression patterns and their regulatory relationships in Drosophila and Tribolium.
Top panel: Late blastodermal expression patterns of gap genes (non-terminal, non-head) in Drosophila and their regulatory relationships. Bottom panel: post-blastodermal expression patterns of gap genes (non-terminal, non-head) in Tribolium after they emanate from the growth zone and before they fade, and a parsimonious interpretation of their regulatory relationships. An arrow represents positive regulation and a blunt line represents negative regulation. G= gnathal segment, T= thoracic segment, A= abdominal segment.

