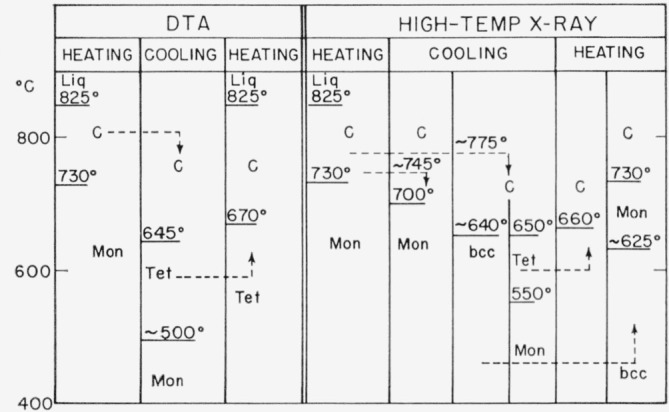
Figure 1. Schematic representation of results of differential thermal analysis (DTA) and high-temperature x-ray experiments on Bi2O3.

Dashed arrows indicate changes in direction of the heating and cooling schedule. Polymorphs: Mon—monoclinic, C—cubic, Tet—tetragonal, b.c.c.—body-centered cubic.
