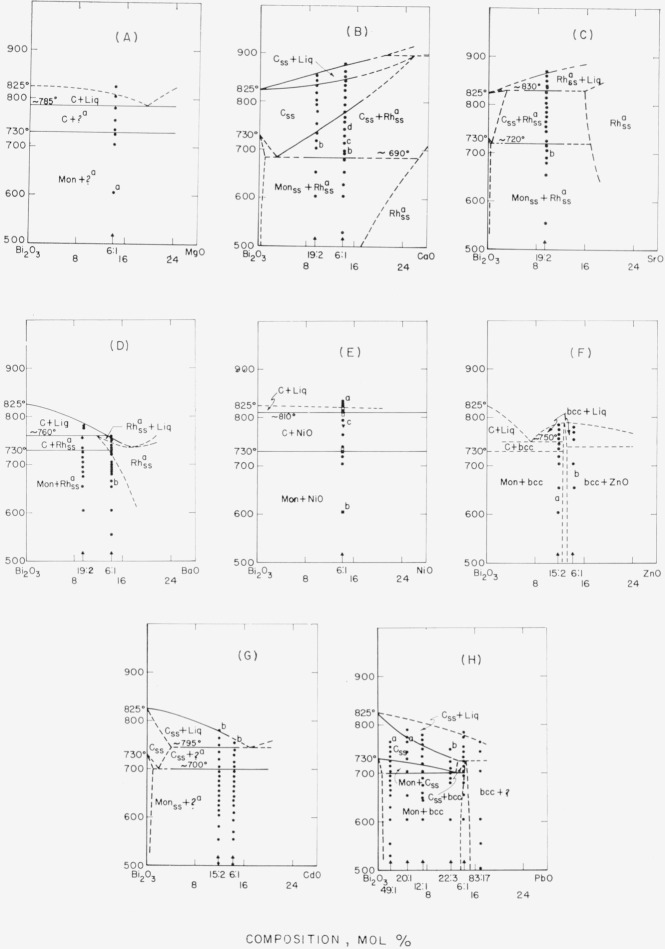
Figure 2. Bi2O3 rich regions of Bi2O3–RO systems, as determined from high-temperature x-ray diffraction data.
Phases: Mon—monoclinic, C—cubic, b.c.c.—body-centered cubic, ?—unknown, Rh—rhombohedral, ss—solid solution, Liq—liquid
(A) Bi2O3–MgO
a—Second phase, possibly MgO.
(B) Bi2O3–CaO
a—Described by Aurivillius (1943) [7].
b—Cubic Bi2O3 ss starting to form,
c—Cubic Bi2O3 ss increasing; Mon Bi2O3 decreasing,
d—Mon Bi2O3 gone.
The 6:1 composition slow-cooled from 700 °C (after 107 hr soaking period) shows single phase Rhss. See table 1 for unit cell dimensions.
(C) Bi2O3–SrO
a—Described by Sillén and Aurivillius (1939) [8].
b—Rhss increasing; Mon decreasing. See table 1 for unit cell dimensions.
(D) Bi2O3–BaO
a—Described by Aurivillius (1943) [7].
b—Rhss increasing; Mon decreasing. See table 1 for unit cell dimensions.
(E) Bi2O3—NiO
a—Liq cools to b.c.c.
●—First heat
□—b.c.c. reheated
■—Superposition of ● and □.
▼ -Reheated sample cooled from liq to 780 °C
b—b.c.c. decomposing to Mon.
c—Cubic phase when cooled to room temperature shows b.c.c.
(F) Bi2O3—ZnO
a—No Mon detected.
b—ZnO detected only in specimen soaked 107 hr at 700 °C and then slow-cooled.
The two compositions studied indicate that the b.c.c. phase is stable and melts congruently.
Beyond this the diagram is conjectural.
G) Bi2O3—CdO
a—Possibly one of Sillén’s reported CdO—Bi2O3 phases [9].
b—Liq cools to b.c.c.
(H) Bi2O3—PbO
a—Css cools to b.c.c.
b—Css+ Liq cools to b.c.c.

