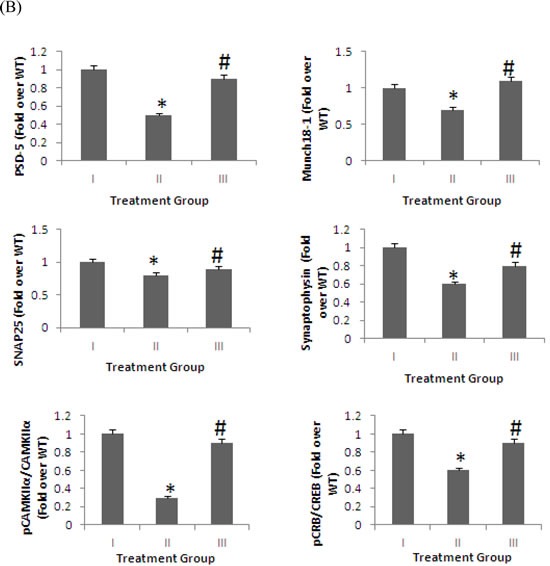
Figure 1. Synaptic structural proteins in brain homogenates detected by Western blot analysis.

The levels of PSD-95, Munc18-1, SNAP25, synaptophysin, p-CaMKIIα/ CaMKIIα, and pCREB/CREB in the brains of mice fed 4% pomegranate diet for 15 months. Treatment I: Wild type (non-transgenic) control of the APPsw mice fed with regular diet; Treatment II: APPsw mice also fed with regular diet; and Treatment III: APPsw mice fed with 4% pomegranate fruit diet. A. The blot shown is representative tracings of an experiment done six times. B. Graphs are mean ± S.E brains from tissue obtained from six rodents for each treatment group. Each bar of the quantification graph represents the corresponding band for each age group. Significance *p < 0.01 compared to wild-type mice fed with regular diet, #p < 0.01 compared to APPsw transgenic mice fed with regular diet.
