
Figure 3. Histograms depicting the means and standard deviations of the chemiluminescence values for (A, B) HSP 90, (C, D) HSP 70 and (E, F) caspase-3 in rats radiated at 2W or 4W, in the right and left hemispheres of the cerebral cortex for each group: GI (900 MHz), GII (2.45 GHz), GIII (0.9+2.45 GHz) and GIV (control).
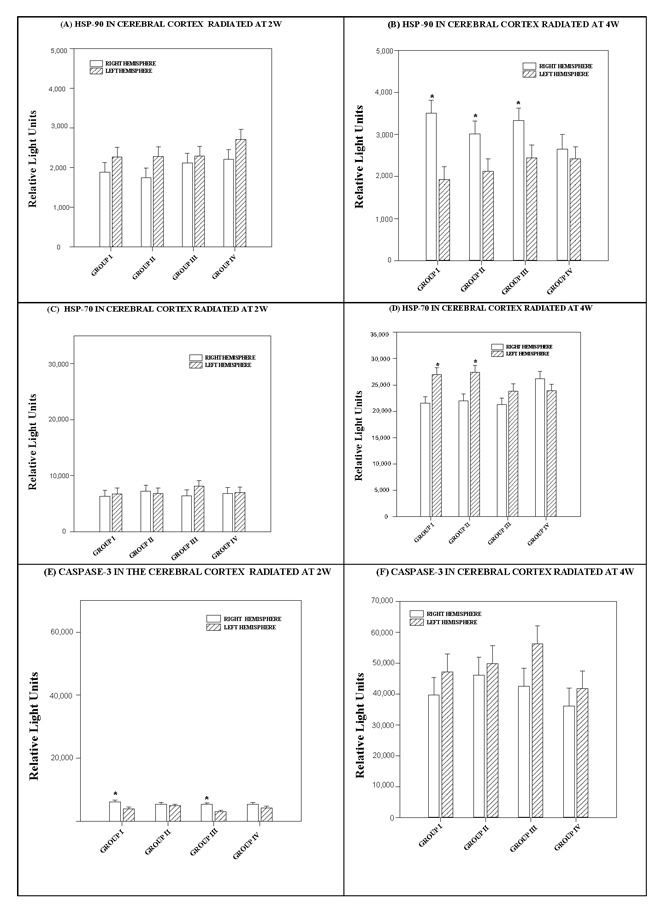
* indicates significant differences (p < 0.05) between right and left hemispheres.