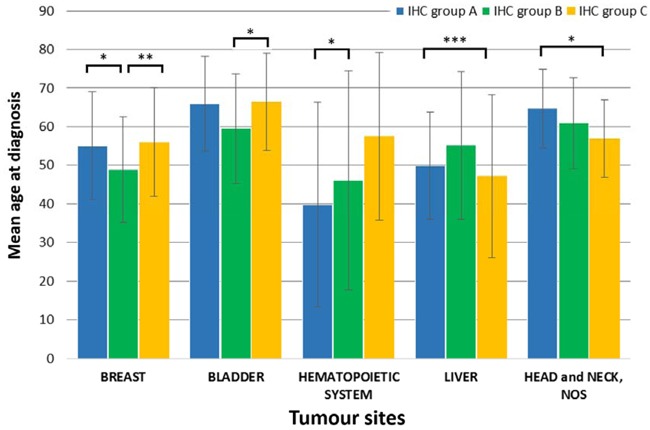
Figure 2. Significant differences of mean age of TP53 mutation carriers between IHC groups were found in five tumour sites.

Bar graphs represent data in mean ± standard deviation (SD). Level of significance: * (p < 0.05), ** (p < 0.01), and *** (p < 0.001).
