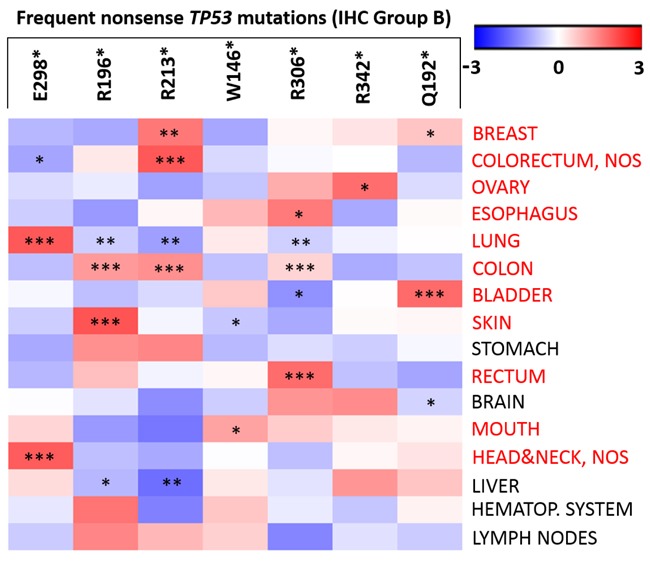
Figure 3. Frequency differences of nonsense TP53 (Group B) mutations across tumour sites.

The ‘heat map’ shows the different frequency of the seven nonsense TP53 mutations (ranging from −3 to 3) across tumour sites (compared to their overall frequency in IARC database). A heat-map of nonsense TP53 mutations were constructed using Gene-E version 3.0.204 (http://www.broadinstitute.org/cancer/software/GENE-E/index.html). Level of significance: * (p < 0.05), ** (p < 0.01), and *** (p < 0.001).
