
Figure 2. MCL improves the survival of mice with human AML.
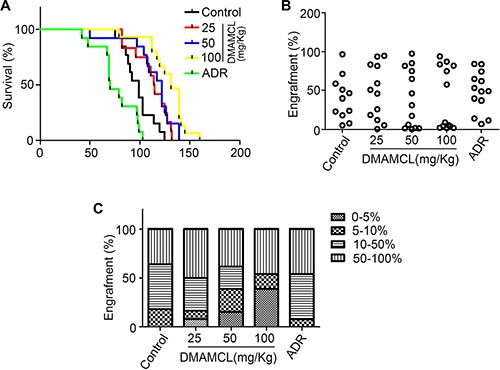
(A) Survival plot representing the percentage of surviving NOD/SCID mice injected with human AML cells and treated with varying doses of DMAMCL. (B) Percentage of CD45+ cell engraftment in the bone marrow of mice after treatment with control, DMAMCL, or ADR. (C) Percentage of mice exhibiting varying degrees of leukemic cell engraftment after treatment with control, DMAMCL, or ADR. Administration of PBS is represented by Control and ADR was administered as a positive control.