
Figure 5. The NEAT1/miR-129-5p axis mediates the effect of BRCA1 deficiency to enhance malignancies and stemness of breast tumor cells.
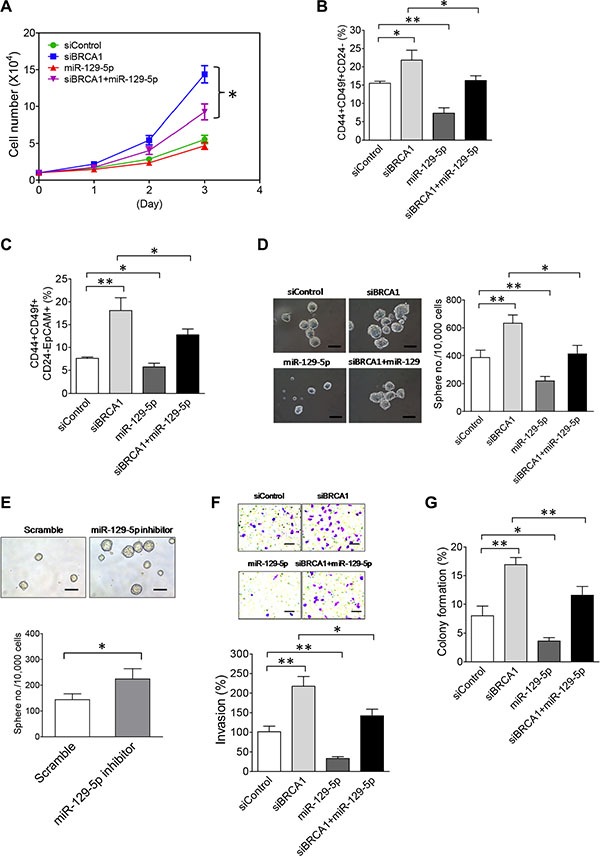
(A) The miR-129-5p mimic attenuates enhanced proliferation of BRCA1-knockdown MCF10DCIS cells. MCF10DCIS cells were transfected with the control siRNA, BRCA1 siRNA, miR-129-5p mimic or BRCA1 siRNA plus miR- 129- 5p mimic. At 24 hrs after transfection, 10,000 transfected MCF10DCIS cells were seeded for cell proliferation assays as described in Figure 3B. (B) The miR-129-5p mimic abolishes the BRCA1-knockdown-induced increase of the BCSC cell population in MCF10DCIS cells. Flow cytometry analysis of BCSC protein antigens CD44, CD49f and CD24 was performed on transfected MCF10DCIS cells 72 hours posttransfection as indicated. The gating and analysis were performed as described in Figure 3C. The quantitative bar graph was plotted based on percentages of CD44+CD49f+CD24– cell subsets from three independent flow cytometry experiments. (C) The miR-129-5p mimic reduces the BRCA1-deficiency-induced expansion of the EpCAM+BCSC population in MCF10DCIS cells. Flow cytometry analysis of BCSC protein antigens CD44, CD49f, CD24 and EpCAM was performed on transfected MCF10DCIS cells 72 hours posttransfection as indicated. The gating and analysis were performed as described in Figure 3D. Quantitative analysis of the EpCAM+BCSC subset (CD44+CD49f+CD24–EpCAM+) for a representative flow cytometry experiment is also shown in Supplementary Figure S9. The quantitative bar graph for the measurement of the CD44+CD49f+CD24–EpCAM+ cell subset was plotted based on three independent experiments. (D) The miR-129-5p mimic impairs BRCA1-knockdown-induced increases in the size and formation efficiency of BCSC spheres developed from MCF10DCIS cells. At 48 hrs after transfection, 10,000 transfected MCF10DCIS cells as indicated were seeded for stem-cell sphere formation assays. The pictures of formed BCSC spheres are shown in the left panel and the BCSC sphere formation efficiency data are shown in the right panel. The scale bar in sphere pictures indicates 100 μm. (E) Inhibition of miR-129-5p enhances the stemness of MCF10A cells. Stem-cell sphere formation assays were performed on MCF10A cells transfected with either the control scramble or miR-129-5p inhibitor RNA. The mammosphere pictures are shown in the top panel and the quantitative bar graph of the mammosphere formation efficiency data is shown in the bottom panel. The scale bar indicates 100 μm. (F) The miR-129-5p mimic impairs the BRCA1-knockdown-induced enhancement of invasiveness of MCF10DCIS tumor cells. Transfected MCF10DCIS cells as indicated were subjected to invasion assays 48 hours posttransfection. The stained pictures are shown in the top panel and the quantitative bar graph of invasion data is shown in the bottom panel. The scale bar indicates 100 μm. (G) The miR-129-5p mimic attenuates a BRCA1-knockdown-induced increase in anchorage-independent growth of MCF10DCIS tumor cells. Transfected MCF10DCIS cells as indicated were subjected to soft agar assays 48 hours posttransfection. Colony formation efficiency data from three independent experiments were plotted into a bar graph. The error bar in bar graphs represents the SD of the dataset (n = 3). *p < 0.05, **p < 0.01.