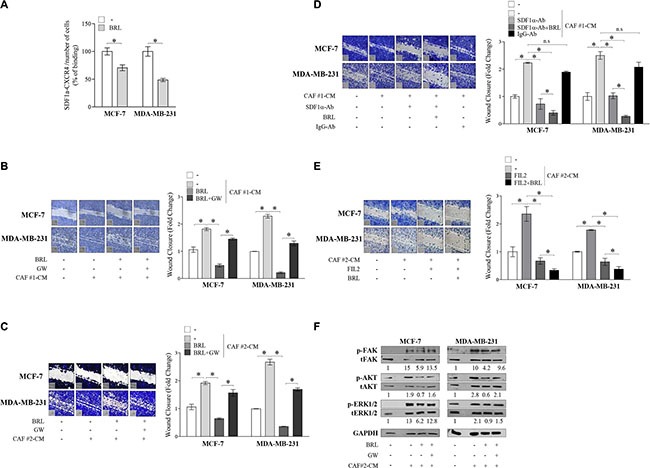
Figure 5. BRL antagonizes motility and signaling activation induced by cancer-associated fibroblasts -derived conditioned media in breast cancer cells.

(A) CAF-secreted SDF-1α ligand binding to breast cancer cells was analyzed by ELISA at 450 nm of absorbance (Abs) as described in Material and Methods. The results are expressed as percentage of optical density (OD) respect to vehicle-treated cells. The values represent the mean ± SD of three different experiments, each performed with triplicate samples. (B and C) Wound-healing assays in MCF-7 and in MDA-MB-231 cells treated with phenol-red and serum-free medium (−), conditioned media derived from cancer-associated fibroblasts (CAF-CM), BRL 10 μM with or without GW 10 μM for 24 h. Small squares, time 0. Histograms represent the mean ± SD of three separate experiments in which migrated cells were calculated by image analysis using Image J software and expressed as fold change compared to vehicle-treated cells. *P < 0.05. (D) Wound-healing assays in MCF-7 and in MDA-MB-231 cells treated with phenol-red and serum-free medium (−), CAF #1-CM and/or SDF-1α-depleted conditioned media (SDF-1α-Ab) with or without BRL 10 μM for 24 h. Conditioned media treated with a nonspecific IgG as a control (IgG-Ab). Small squares, time 0. Histograms represent the mean ± SD of three separate experiments in which migrated cells were calculated by image analysis using Image J software and expressed as fold change compared to (−) treated cells. *P < 0.05. (E) Wound-healing assays in MCF-7 and in MDA-MB-231 cells treated with phenol-red and serum-free medium (−), CAF #2-CM, FIL2 1 μM with or without BRL 10 μM for 24 h. Small squares, time 0. Histograms represent the mean ± SD of three separate experiments in which migrated cells were calculated by image analysis using Image J software and expressed as fold change compared to (−) treated cells. *P < 0.05. (F) Immunoblots of phosphorylated (p) FAK, AKT and ERK1/2 and total proteins from cells treated as in C. Numbers below the blots represent the average fold change between phosphorylated, total and GAPDH protein expression vs vehicle-treated cells. GAPDH, glyceraldehyde-3-phosphate dehydrogenase. CAFs: Cancer-associated fibroblasts; CM: Conditioned media.
