
Figure 4. GATA3 orchestrates the phenotypic changes induced by suppression of ELK3 in MDA-MB-231 cells.
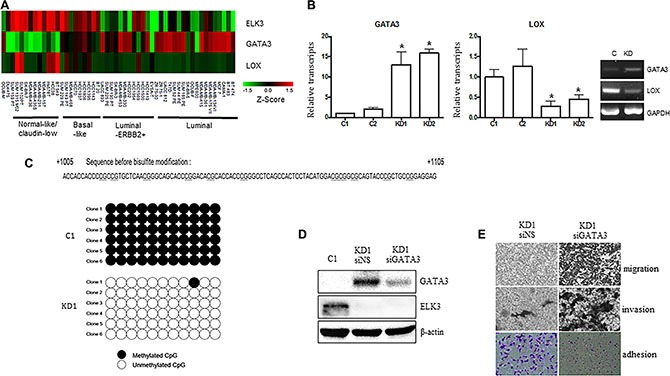
(A) Expression of ELK3, GATA3, and LOX, as shown on a heat map matrix derived from publicly available microarray data from 18 luminal, 12 luminal-ERBB2+, nine basal-like, 11 normal-like/claudin-low, and one other cell type [19]. (B) Relative expression of GATA3 and LOX in C1, C2, KD1, and KD2 cells. (C) Bisulfite sequencing analysis of the GATA3 promoter in C1 and KD1 cells. Each line reflects an independent clone. The white and black circles represent unmethylated and methylated CpG dinucleotides, respectively. (D) SiRNA-mediated suppression of GATA3 expression in KD1 cells. KD1 cells were transfected with a nonspecific siRNA (siNS) or with siRNA targeting GATA3 (siGATA3) for 48 h, and total cell extracts were analyzed by immunoblotting. (E) Migration, invasion, and adhesion of KD1 cells transfected with siNS or siGATA3 for 48 h (as described in Materials and methods). Error bars represent the standard error from three independent experiments, each performed using triplicate samples. *P < 0.05 (Student's t-test).