
Figure 1. Assessment of apoptosis in cells treated with 10–6, 10–5, 10–4 and 10–3 mol/L NaF.
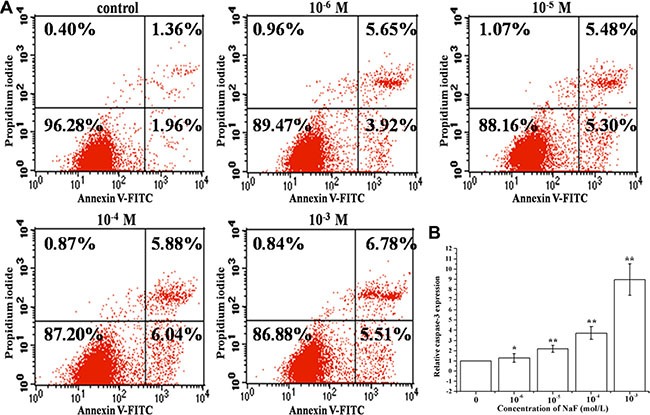
(A) The apoptotic rates were detected by FCM of annxin V-FITC/PI dual staining. Q1 quadrant (annexin V–, PI+) represented dead cells; Q2 quadrant (annexin V+, PI+) represented late apoptotic cells; Q3 quadrant (annexin V+, PI–) represented early apoptotic cells; Q4 quadrant (annexin V–, PI–) represented live cells. (B) The caspase 3 mRNA levels were detected using RT-PCR assay. Columns, mean of three independent experiments; mean ± SD; *P < 0.05,* *P < 0.01; #P < 0.05; ##P < 0.01. The same as below.