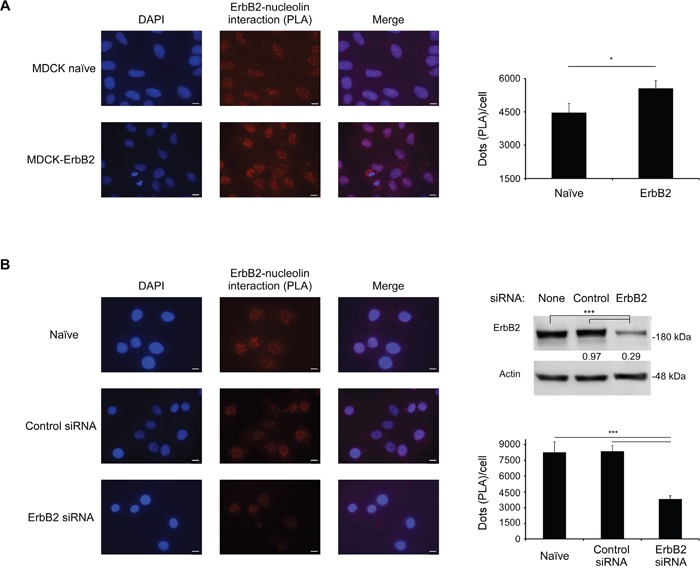
Figure 1. ErbB2 and nucleolin interact in intact cells.

A. Left panel, visualization of the interaction between ErbB2 and nucleolin (red dots) in naïve MDCK cells and MDCK ErbB2-expressing clones was performed using a proximity ligation assay (PLA). Right panel, differences between signal intensity in both cell lines represented as the number of dots per cell (means ±SE). B. Left panel, visualization of the interaction between ErbB2 and nucleolin (red dots) in SKBR3 untreated cells and cells treated with either control siRNA or ErbB2-specific siRNA. Upper right panel, a western-blot analysis of ErbB2-siRNA treatment effect on ErbB2 levels in SKBR3 cells; numbers below bands indicate average fold induction of untreated. Lower right panel, differences in signal intensity represented as number of dots per cell (means ±SE).
