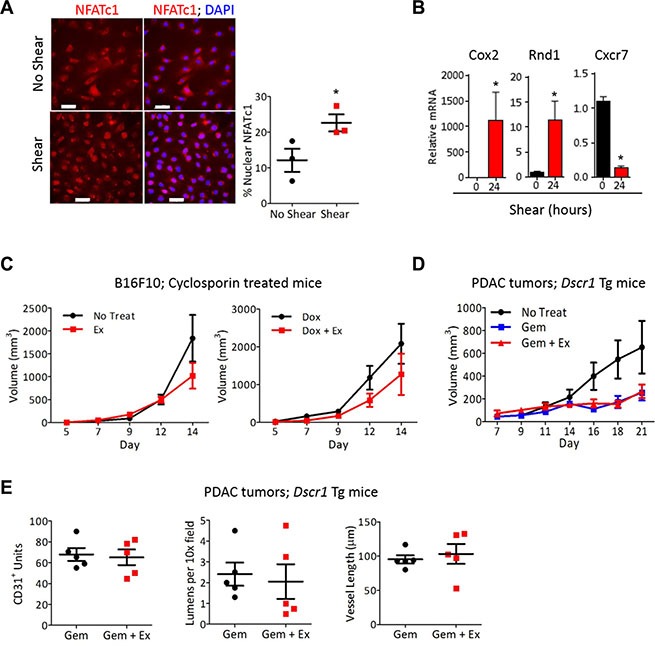
Figure 5. NFAT is necessary for vascular normalization by exercise-induced shear stress.

(A) Representative images of immunofluorescence for NFATc1 (red) and nuclei (DAPI;blue) on mLung ECs after exposure to shear stress for 8 minutes in vitro. The percent of nuclear NFATc1 was quantified for 4 random fields per sample to achieve one value per sample, and is shown as the mean +/− S.E.M *p < 0.05, n = 3, Bars = 50 μm. (B) qPCR analysis for Cox2, Cxcr7, and Rnd1 in ECs exposed to 24 hours shear stress. mRNA normalized to 18s RNA, +/− S.E.M., *p < 0.05, n = 3. (C) B16F10 tumor volumes in wild type mice treated with cyclosporin A, with or without doxorubicin and treadmill running, as indicated. B16F10 cells were injected subcutaneously into WT mice and all mice were treated with cyclosporine A. After tumors were palpable, mice were randomized into either treadmill running or no exercise groups with or without 2mg/kg doxorubicin weekly. Tumor volumes were measured on the indicated days Data are mean +/− S.E.M., n = 5. (D) Tumor growth in Dscr1 transgenic (Tg) mice. PDAC-4662 cells were injected subcutaneously into Dscr1 Tg mice. After tumors were palpable, mice were randomized into either treadmill running or no exercise groups. Tumor volumes were measured on the indicated days and are shown as the mean +/− S.E.M., *p < 0.05, n = 5 per group. (E) Quantification of vascular normalization. PDAC-4662 tumors from Dscr1 Tg mice were assessed by immunofluorescence staining for microvessel density, lumens per field, and mean vessel length. 5 sections per tumor were quantified and used to obtain one value per tumor. Each marker represents one tumor, n = 5, not significant.
