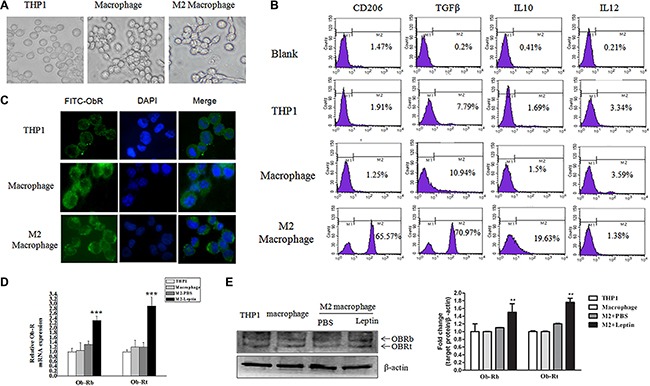
Figure 1. Leptin stimulated ObR expression in M2 macrophages.

THP1 cells were treated with PMA (100 nM, 72 hours) plus IL-4 (20 ng/mL, 36 hours) to induce M2 macrophage differentiation. (A) Representative phase contrast images of THP1 cells, THP1 macrophages, and M2 macrophages. (B) Flow cytometry analysis of the expression of CD206, TGF-β, IL-10, and IL-12 in THP1 cells, THP1 macrophages, and M2 macrophages. (C) Representative images of immunofluorescence staining for ObR in THP1, THP1 macrophages, and M2 macrophages. Images are at magnification of 400×. (D) qRT-PCR analysis of the mRNA level of long form (ObRb) and short form (ObRt) leptin receptor in THP1, THP1 macrophage, and M2 macrophages treated with PBS or leptin. (E) A representative image of Western blot and densitometry analysis showing the expressions of ObRb and ObRt in THP1, THP1 macrophages, and M2 macrophages. **represent significant difference between the M2 + leptin group versus the M2 + PBS group, P < 0.01.
