
Figure 6. High-throughput gene expression microarray.
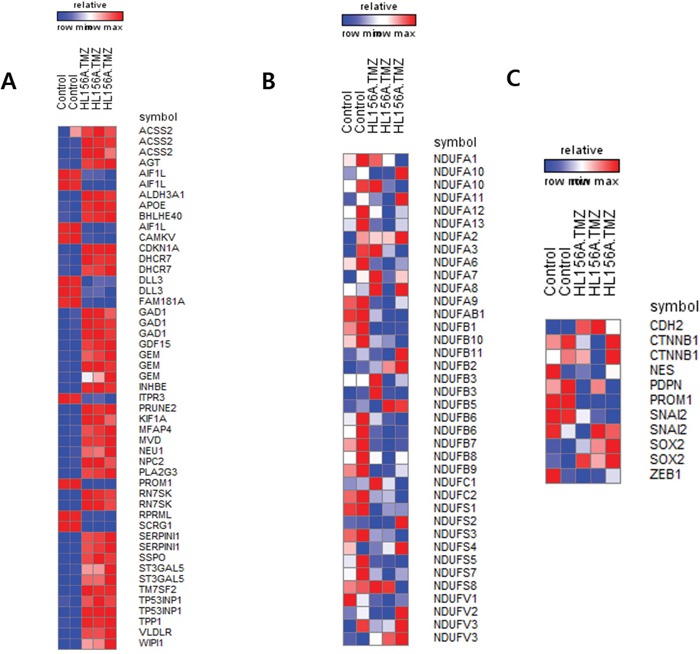
A. Differentially expressed genes between control and the combination treatment group. B. Expression of mitochondria complex I genes. Some genes were down-regulated in the combination treatment group. C. Expression of selected genes. CD133 (PROM1), podoplanin (PDPN), and ZEB1 were down-regulated in the combination treatment group, consistent with the results of Western blot analyses.