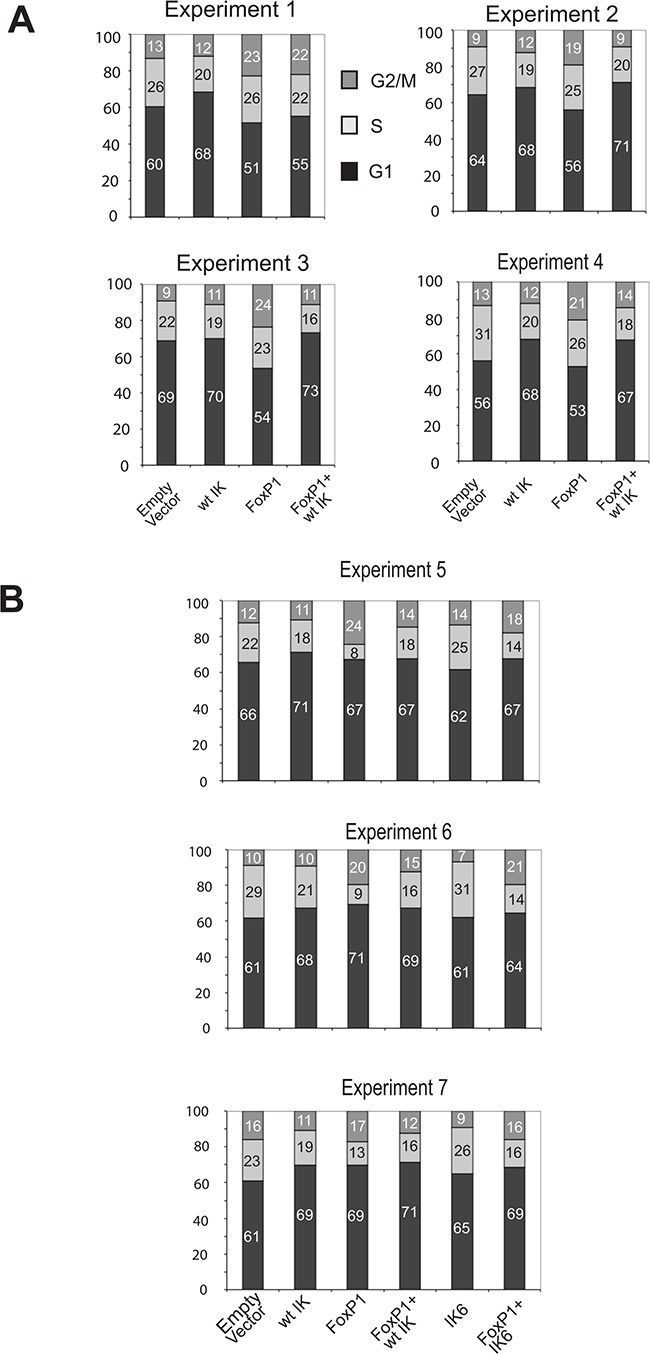
Figure 5. Cell cycle effects of Foxp1 are antagonised by wild-type Ikaros but not by IK6.

A. Percentage of cells at different stages of the cell cycle analysed by PI staining and FACS. Data was obtained from 4 experiments where B3 pre-B cells were transduced with Ikaros and/or Foxp1 retroviral expression constructs. Individual percentage values (rounded to whole numbers) are shown within the histograms. Examples of the FACS profiles used to generate the cell cycle charts are shown in Figure S3. B. Percentage of cells at different stages of the cell cycle for 3 additional experiments where the effect of transducing cells with an IK6 expression vector on Foxp1-induced cell cycle changes was compared with the effect of expressing wild-type Ikaros.
