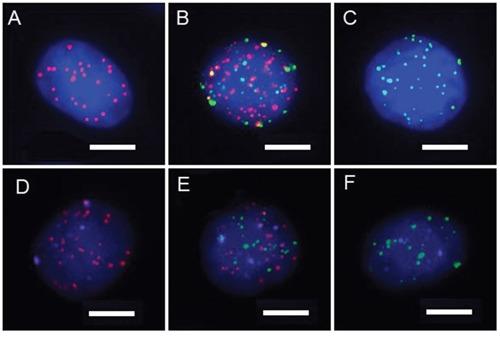
Figure 1.

A-C. CTC subpopulations classified by categorical markers (A: epithelial CTCs, B: biophenotypic epithelial/mesenchymal CTCs, and C: mesenchymal CTCs). Red dots: epithelial biomarker expression. Green dots: mesenchymal biomarker expression.(Bars=5 μm). D-F. HR expression status of CTCs based on the expression levels of three reference genes. (D: epithelial CTCs, E: biophenotypic epithelial/mesenchymal CTCs, and F: mesenchymal CTCs). Purple dots: HR expression.(Bars=5 μm).
