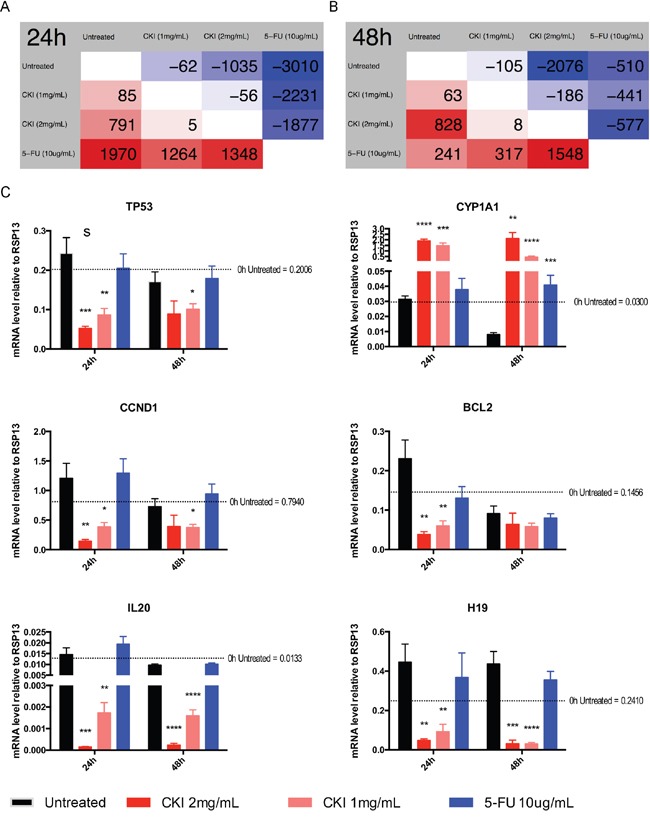
Figure 2. Differential gene expression in MCF-7 cells treated with CKI or 5-FU for 24 and 48 hours.

Numbers of DE genes (FDR < 0.05 according to edgeR) between different groups at A. 24 hours or B. 48 hours time. Comparison is based on row against column. Therefore, cells with a red background show numbers of up-regulated genes and cells with a blue background show numbers of down-regulated genes. C. Validation of transcriptome sequencing. Total of 6 DE genes (TP53, CCND1, CYP1A1, BCL2, IL-20 and H19) identified by transcriptome sequencing were selected and were subjected to validation analysis by qPCR. Data are represented as mean ±SEM (n=9). Statistical analyses were performed using t-test comparing with “untreated” (*p<0.05, **p<0.01, ***p<0.001, ****p<0.0001).
