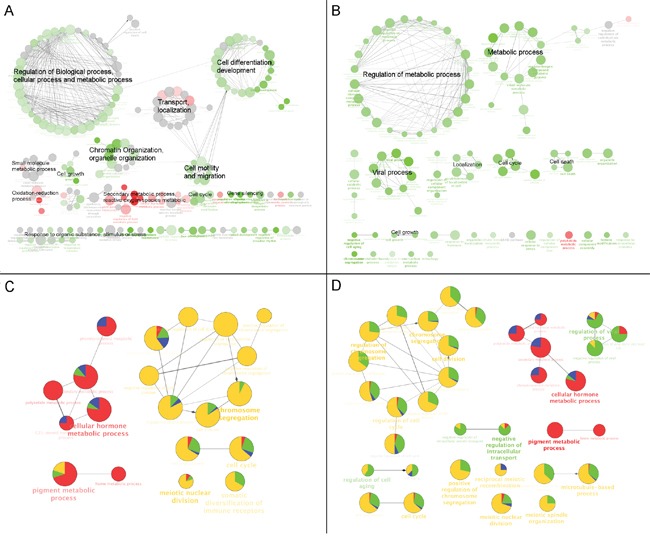
Figure 3. GO functional annotation of DE genes in CKI treated cells.

Over-represented GO terms (Biological Process at 3rd level) for DE genes identified from comparison of CKI treated cells against untreated cells for A. 24 hours or B. 48 hours. Red coloured nodes mean more than 60% of DE genes that contributed to a term were up-regulated and green coloured nodes mean more than 60% of DE genes that contributed to a term were down-regulated. The colour gradient represents the proportion of up- or down- regulated genes between these cut offs, and the node size is proportional to the significance of over-representation. Terms with similar functional classifications are connected with edges and the most significant term in each cluster is shown in bold. Comparison of over-represented GO terms for the top 200 significant DE genes in cells treated with 2 mg/mL CKI or 5-FU for C. 24 hours or D. 48 hours. Four different colours were used to represent the proportion of DE genes from up- or down- regulated genes. For CKI (red = up-regulated and green = down-regulated) or 5-FU (blue = up-regulated and yellow = down-regulated). Node size is proportional to the significance of over-representation and terms with similar functional classifications are connected with edges and the most significant term in each cluster is shown in bold.
