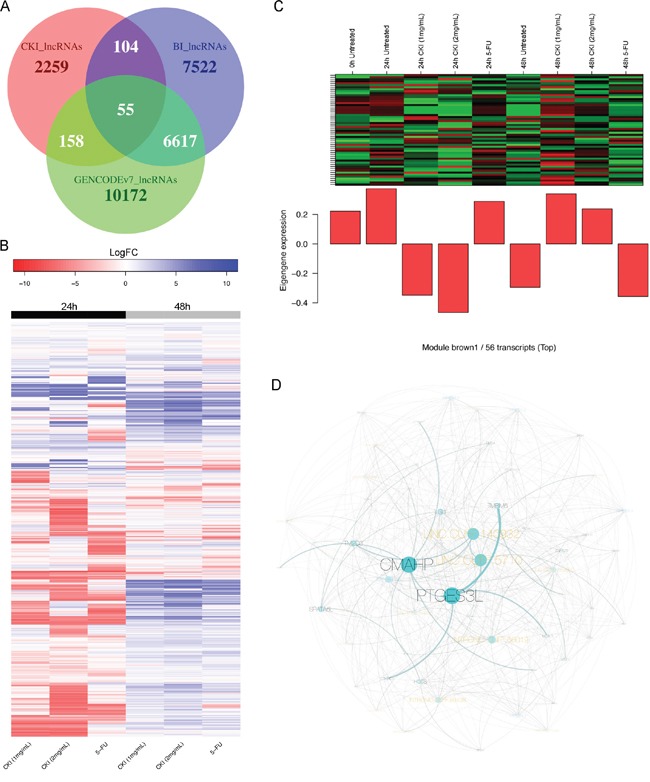
Figure 8. Expression change of de novo identified lncRNAs and an example of a CKI-specific co-expression module.

A. Overlap of de novo identified lncRNAs (CKI_lncRNAs) with two annotated human lncRNA datasets: “BI_lncRNAs” as annotated lncRNAs from the Broad Institute and “GENCODEv7_lncRNAs” as lncRNAs from GENCODE version7. B. Heatmap showing expression fold change of 2,287 lncRNAs in 6 treated cell samples compared to corresponding untreated cells. C. Expression pattern of transcripts in CKI-specific module “brown1” is shown in top panel, and barplot in bottom panel shows the eigengene values in different samples. Green represents “under-expressed” and red represents “over-expressed” in the heatmap. The “eigengene value” is defined as the first principal component of this module, so it can be considered as a representative of the gene expression profiles in this module. D. Visualization of CKI-specific co-expression module “brown1”. The black labels represent refGenes and gold labels represent lncRNAs. The size of the node/label and edge weight are proportional to between-ness betweeness centrality.
