
Figure 3. Rig-G knockdown increases lung cancer cell growth.
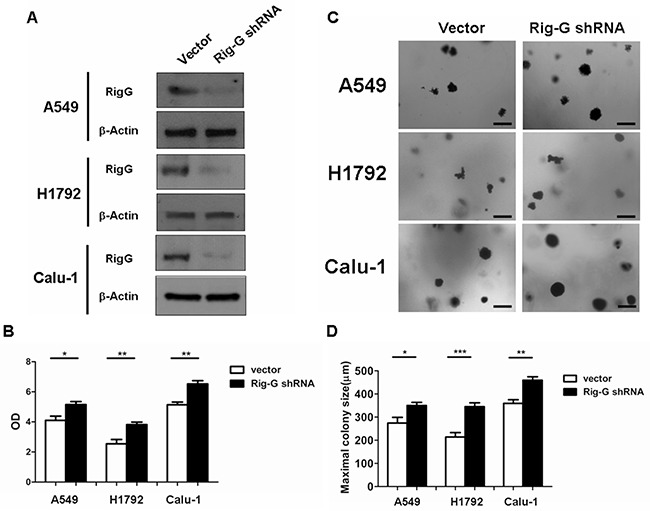
A. Lung cancer cell A549, H1792, and Calu-1 were transduced with indicated shRNA. After selection, expression of Rig-G proteins was analysed. B. The indicated cells were transduced with control or Rig-G shRNA plasmids, and their proliferation was measured by ELISA (BrdU labeling) analysis. The results are expressed as the mean ± SEM, *p < 0.05; **p < 0.01. C. The growth of tumor cells transduced with indicated shRNA plasmids in soft agar was assessed by using an anchorage-independent colony formation assay. Scale bars = 500 μm. D. The maximum colony size assay in A549, H1792, and Calu-1 cells transfected with the indicated shRNA plasmids. The results are expressed as the mean ± SEM, *p < 0.05; **p < 0.01; ***p < 0.001.