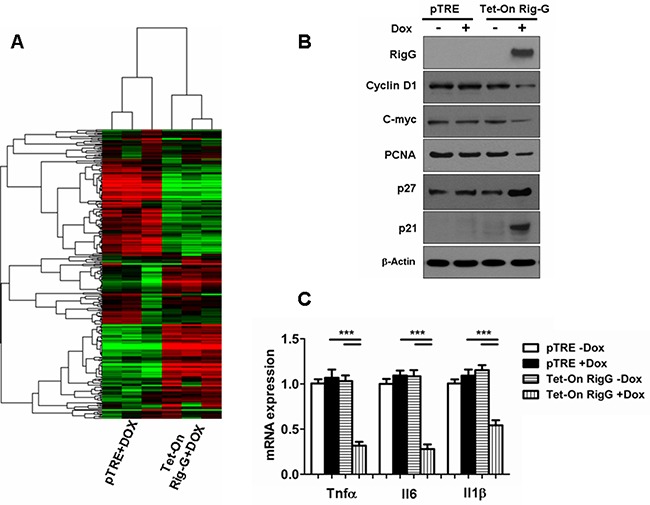
Figure 5. Rig-G inhibits specific growth pathways and inflammatory responses in tumor cells.

A. Heat map of the experimental groups. Dendrogram and cluster analyses show a differential gene expression profile pattern in A549 cell lines with (right) and without (left) Rig-G overexpression. Green indicates downregulation, and red indicates upregulation. B. The expression of proliferation-related proteins in the indicated cells was analyzed by western blotting. C. Induction of inflammatory cytokine mRNAs in the indicated cells was measured by real-time PCR. The results are expressed as the mean ± SEM (n = 5), ***p < 0.001.
