
Figure 1.
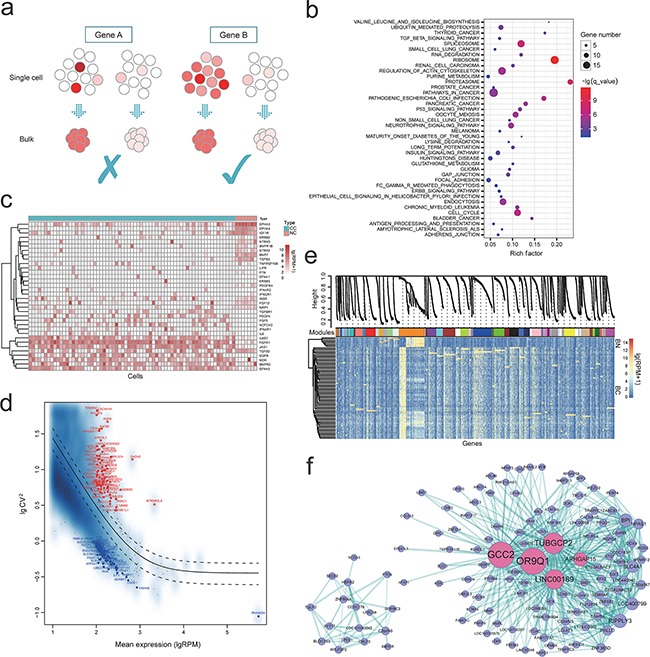
a. Bulk approaches were conducted on a “population level” by using the average transcriptomes of millions of cells, frequently fail to uncover the subtle but potentially biologically significant differences between seemingly identical cells, while single-cell transcriptomics will uncover the gene expression at single cell level; b. Pathway enrichment of these differentially expressed genes; c. Variation in expression of RTKs pathway in tumor and normal single cells population; d. Coefficient of variation analyses of these genes highly expressed in cancer cells; according to the variability of these highly expressed genes (RPM > 100), the most 50 variably (red) and most 50 stably (blue) expressed genes were marked, individually; e. Gene co-expression modules derived from 74 single cells based on expression level (modules are distinguished by colors); f. Hub-gene network of the “darkorange” module in e, and the size of the dots represents hubness. Pink highlights the genes being discussed in the text.