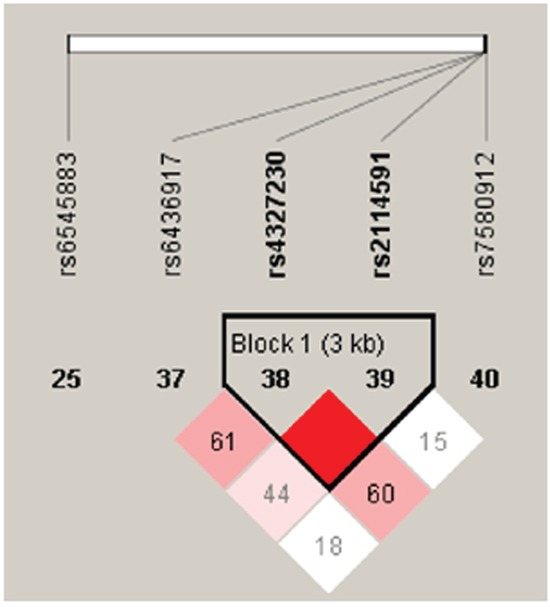
Figure 1. Haplotype block map for SP110 tSNPs.

Block 1 includes rs4327230 and rs2114591. The coefficient of linkage disequilibrium (D) between two SNPs is normalized to D' (D/Dmax) (red schemes).

Block 1 includes rs4327230 and rs2114591. The coefficient of linkage disequilibrium (D) between two SNPs is normalized to D' (D/Dmax) (red schemes).