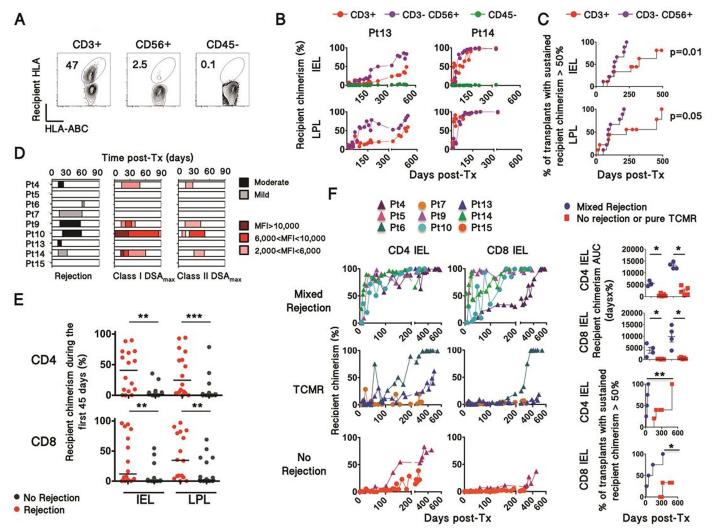
Figure 1. Relationship between rejection and recipient chimerism in intestinal allografts.
(A) Representative plots (from Patient 14) depicting recipient chimerism in cell subsets isolated from graft biopsies (n=183). Chimerism was detected using recipient HLA allele-specific and pan-HLA class I antibodies. (B) Replacement rate of donor CD3+, CD3− CD56+ and CD45− cells by recipient cells (recipient chimerism) over time in IELs and LPLs, isolated from serial protocol biopsies. The 2 selected patients depict different T-cell turnover kinetics. Panels C, D, E depict 170 biopsies obtained from 9 patients with a longitudinal follow-up from POD0 to up to POD600. (C) Kaplan Meier curves plot the proportion of transplants for which recipient cells permanently exceeds 50% in the indicated cell populations over time. Survival curves were compared using Log-rank (Mantel-Cox) Test. (D) Graphic representation showing the severity/intensity and period of rejection episodes (left) and donor-specific antibodies (right) during the first three months post-transplant. MFI, mean fluorescence intensity. DSA, Donor-Specific Antibody. (E) Recipient chimerism in CD4 and CD8 IEL and LPL within the first 45 days (Mann-Whitney U test; ** p<0.01, *** p<0.001). (F) Recipient chimerism over time in CD4+ and CD8+ αβTCR+ IELs isolated from serial biopsies, according to the occurrence of mixed rejection, TCMR or no rejection. Dots and triangles represent multivisceral transplant and isolated intestinal transplant recipients, respectively. AUC, Area Under the Curve; Pt, Patient; TCMR, T-cell-mediated rejection. Turnover kinetics were assessed by the integration of recipient chimerism over time (AUC) and by the 50% turnover rate (right panels), plotting the proportion of transplants for which recipient cells permanently exceeds 50% in the indicated cell population over time. Survival curves and AUC were compared using Log-rank (Mantel-Cox) and Mann-Whitney test, respectively (* p<0.05, ** p<0.01).

