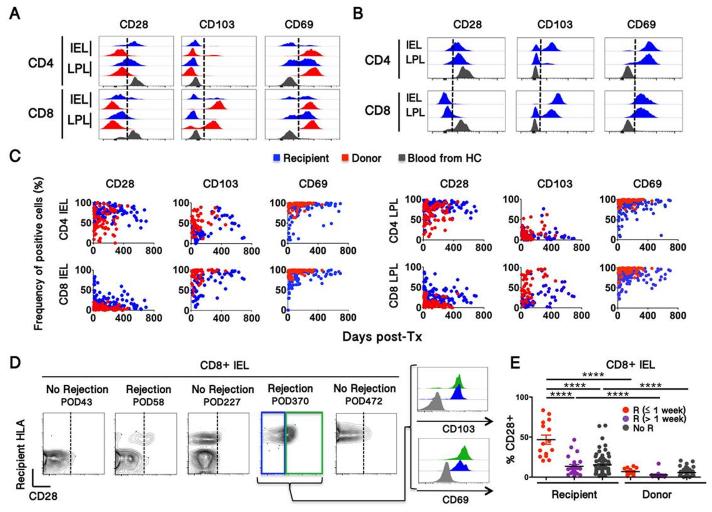
Figure 2. Relationship between recipient intestinal T cell phenotype and rejection.
(A, B) Comparison of recipient and donor IEL and LPL T cell subset phenotypes with that of blood T cells. Representative IEL and LPL at early (a) and late (b) time points are shown. (C) Evolution of recipient and donor T cell phenotype in IEL (left) and LPL (right) over time. CD28, CD103 and CD69 phenotypic information was available for 127, 83 and 120 biopsies, respectively (D) Representative contour plots (from Patient 6) showing CD28 upregulation on recipient but not donor CD8+ IELs during rejection. (E) Summary of CD28 expression by recipient CD8 IEL T cells in relationship to rejection episodes. Frequencies of CD28+ cells were compared using Mann-Whitney test (**** p<0.0001).

