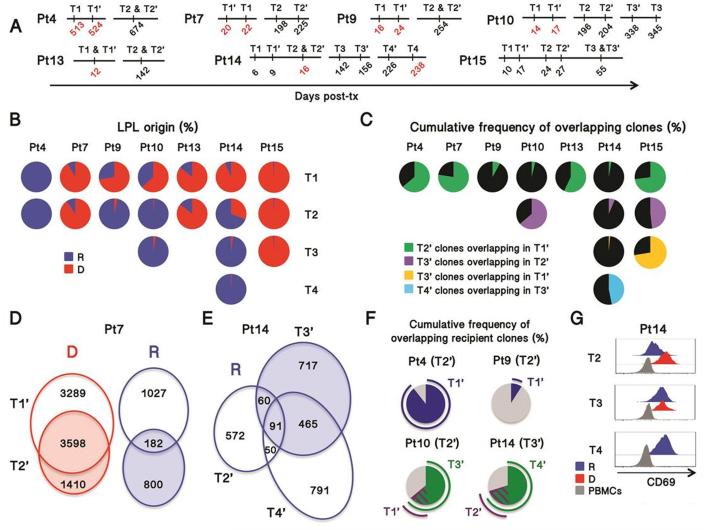
Figure 3. Clonal analysis of recipient T cells in intestinal allografts.
(A): Timeline for biopsies showing rejection (red) or non-rejection (black) analyzed by multicolor FCM (T1-4) or repertoire analysis (T1’-4’) in 7 patients (Pt). (B): Frequency of recipient and donor cells in isolated LPL for 7 patients. IEL cell origin, which was almost superimposable with LPL, is shown in Fig. S7. (C) Cumulative frequency of T cell clones (defined by TCRβ CDR3 sequences) overlapping in sequential biopsies. (D) Venn diagram representing two biopsies (T1’ and T2’) from Patient 7 showing the number of clones detected in each biopsy alone or in both, according to their donor (D) or recipient (R) origin. (E) Venn diagram representing the number of recipient (R) clones overlapping across three biopsies taken from Patient 14 at POD16 (T2’), POD156 (T3’) and POD238 (T4’). (F) Cumulative frequency of the clones identified in a given biopsy (indicated within the brackets) overlapping in other biopsies taken earlier (blue) (Pt4 and Pt9) or both earlier (purple) and later (green)(Pt10 and Pt14). (G) Histograms representing three biopsies taken from Patient 14. R, recipient; D, donor.

