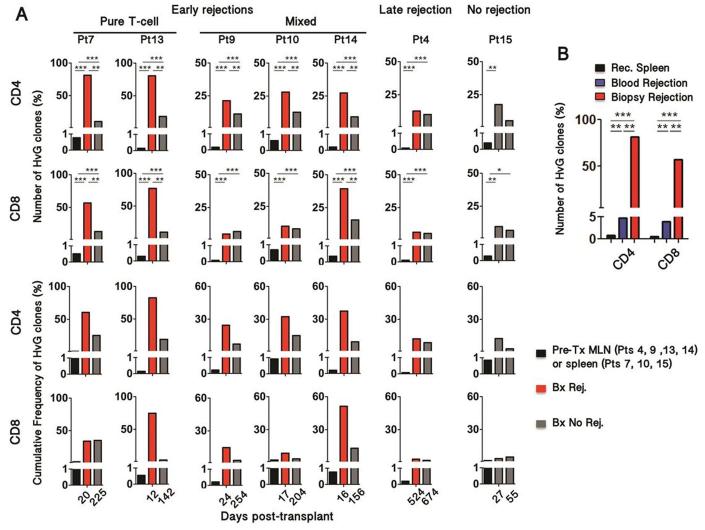
Figure 4. Evolution of host-vs-graft-reactive recipient T cell clones in intestinal allografts.
(A) Frequency of HvG clones in rejecting biopsies (red) compared to pre-transplant lymph node (Pts 4, 9, 13 and 14) or spleen (Pts 7, 10, 15) samples (black) and non-rejecting biopsies (gray). The denominator includes all the clones that were identified in pre-transplant recipient samples (HvG plus all other clones). HvG clone frequencies were compared using Fischer exact test; *** p< 10−25 ; ** p< 10−10 ; * p< 10−3. (B) Frequency of HvG clones in the blood (blue) and in the graft (red) at the time of rejection (POD20) compared to pre-transplant spleen sample in Patient 7 (Fischer exact test; *** p< 10−25 ; ** p< 10−10 ). (C, D) Subsequent analyses were performed in Patient 4, in whom serial biopsies were performed in ileum and colon.

