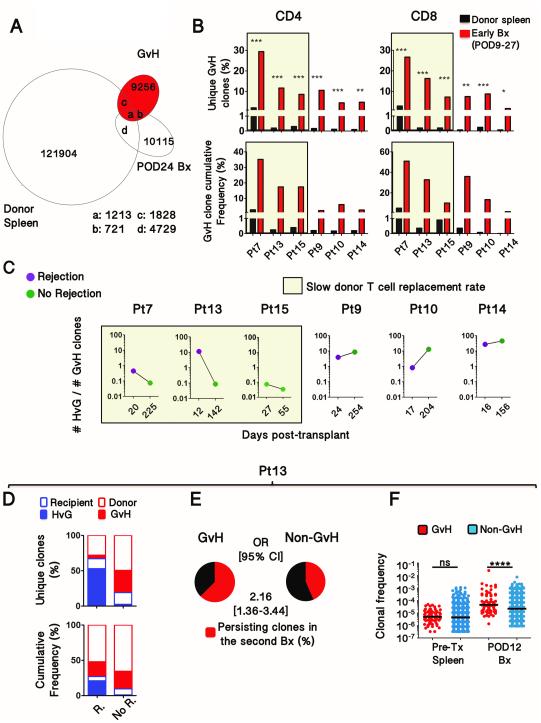
Figure 5. Expansion of GvH clones that may counteract the replacement of donor cells by recipient cells.
(A) Venn diagram depicting the number of T cell clones overlapping between donor spleen total clones, GvH-reactive clones and clones identified as donor-derived in the POD24 biopsy from Patient 7. (B) Frequency of GvH clones in early biopsies (red) compared to pre-transplant donor spleen samples (black). The denominator includes all clones that could be identified in pre-transplant donor samples (Fischer exact test; *** p< 10−25 ; ** p< 10−10 ; * p< 10−3). (C) Evolution of the HvG to GvH clonal ratio after rejection resolution or in the absence of rejection in all patients for whom both HvG and GvH clones were identified in biopsies.. (D) Proportion of HvG and GvH-reactive clones in rejecting (R) and non-rejecting (No R.) biopsies, at POD12 and POD142 respectively, using as denominator the clones identified in pre-transplant recipient or donor samples in Patient 13. (E) From the same patient (Pt13), exhibiting a slow donor T cell replacement rate, proportion of GvH and non-GvH clones from early biopsies (POD12) that were detected in subsequent biopsies (POD142). OR, Odds Ratio. In order to permit comparison in the analysis in (F), only GvH clones that were also detectable in the unstimulated populations were used for this analysis. However, analysis that included all GvH clones provided similar results (p<0.05), yet with a lower OR (~1.5). (F) Comparison of individual clonal frequencies of the GvH and non-GvH clones identified in the early biopsy and pre-transplant samples in Patient 13. Pre-transplant and post-transplant frequencies were compared using Fischer exact test (**** p< 10−4 ). Horizontal bars represent medians.

