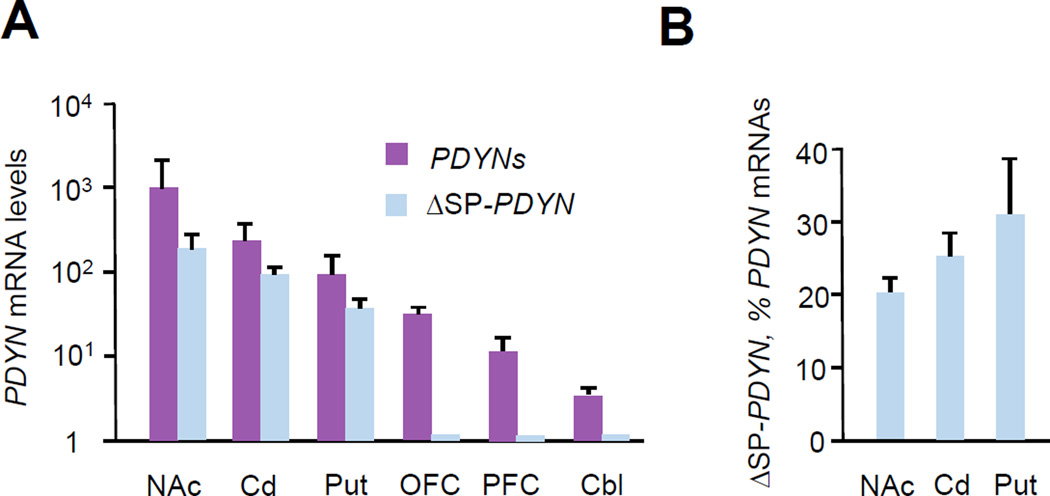
FIGURE 2. The ΔSP-PDYN expression profile in the human brain.
A. The expression levels of mRNAs for ΔSP-PDYN versus dominant PDYN transcripts. Levels were normalized to µg of total RNA. Data are shown as mean ± SEM for nucleus accumbens (NAc); caudate nucleus (Cd); putamen (Put); orbitofrontal cortex (OFC); dorsolateral prefrontal cortex (PFC); cerebellum (Cbl). For Put n = 5 human subject; for other brain areas n = 4 subjects.
B. ΔSP-PDYN mRNA as percentage of dominant PDYN mRNA levels, which have a canonical junction of exons 3–4 and include FL1-, FL2- and ΔSP-PDYN mRNAs. Data is shown as mean ± SEM.

