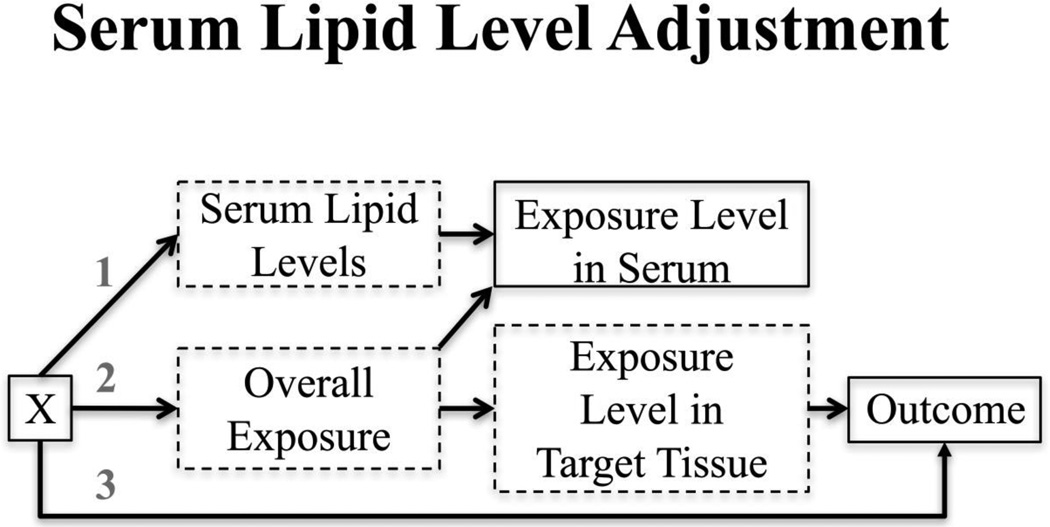
Figure 2.
Variables with solid outlines are observed; those with dashed outlines are unobserved. X represents one or more covariates that could potentially affect serum lipid levels (arrow 1), overall exposure (arrow 2), and/or the outcome (arrow 3). Examples of X include age, sex, BMI, and race. (Reproduced from: O’Brien et al., 2016;124(2):220-7, with permission from Environmental Health Perspectives) [5••].

