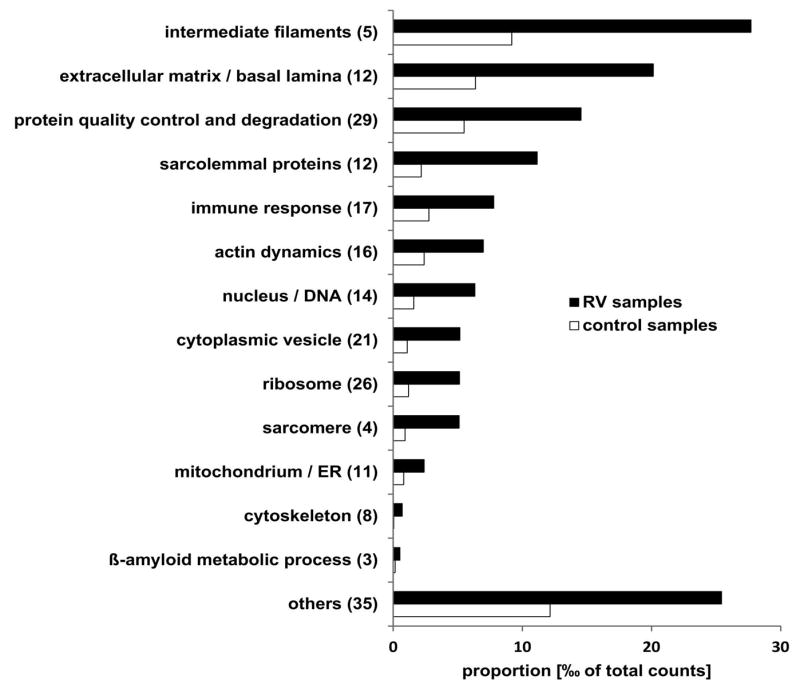
Figure 1. Functional classification of proteins identified as overrepresented in RV samples by proteomic analysis.

Bar chart showing the sum of the mean proportion of proteins assigned to a subgroup is given for RV and control samples in per mill of total spectral counts. The number of detected proteins is given in brackets behind the subgroup name. Black bars show the proportion in RV samples and grey bars the proportion in control samples. Details of proteins assigned to the different subgroups are provided in Supplementary Table 1. ER: endoplasmic reticulum.
