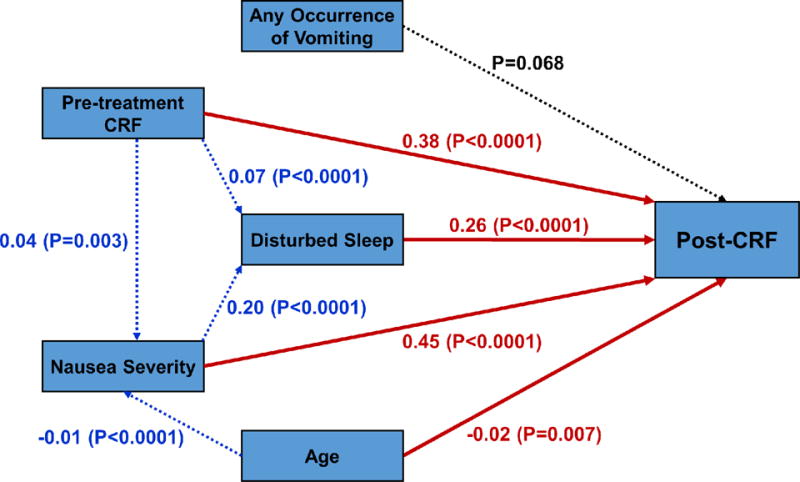
Figure 1.

Diagram for the path model. Statistically significant direct paths to post-CRF from nausea severity, disturbed sleep, pre-treatment CRF and age are colored in red while dotted blue lines show the statistically significant indirect paths (i.e., via other variables) to post-CRF, with selected path coefficients marked (P≤0.05). Direct paths to post-CRF that are not statistically significant are in black.
