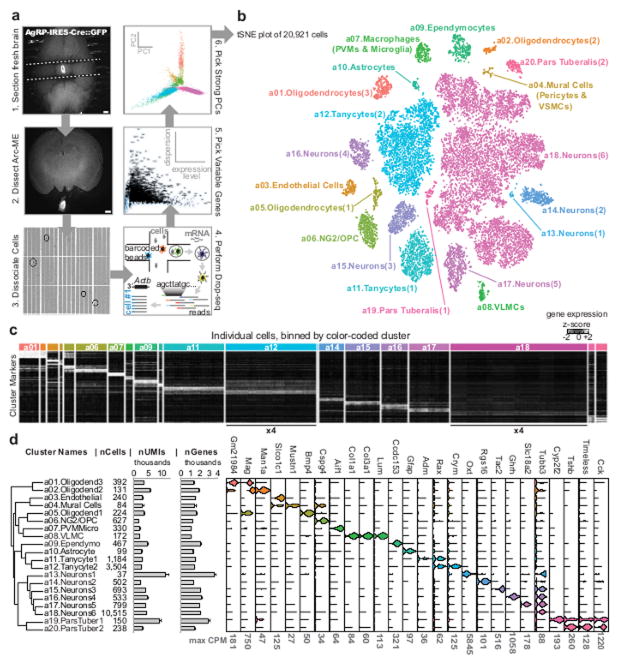
Figure 1. Overview of all cell types.
(A) Schematic of Arc-ME single-cell transcriptomics. (B) Spectral tSNE plot of 20,921 cells, colored per density clustering and annotated according to known cell types. (C) Heatmap of top marker genes for each cluster. The two largest clusters, a12 and a18, were reduced to ¼ size to better visualize the smaller clusters (D) Dendrogram showing relatedness of cell clusters, followed by (from left to right): cluster identification numbers; cells per cluster; mean ± S.E.M. unique molecular identifiers (UMIs) per cluster; mean ± S.E.M. genes detected per cluster; and violin plots showing expression of cell type marker genes.

