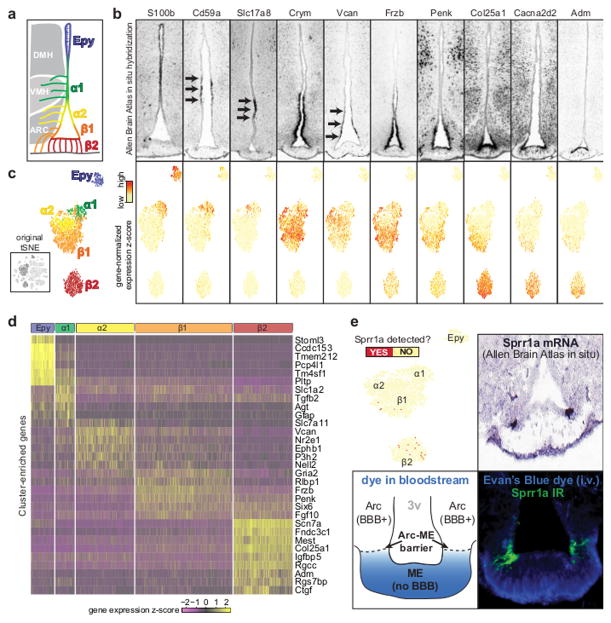
Figure 2. Ependymal cell types.
(A) Illustration of known subtypes of hypothalamic ependymal cells, their approximate anatomical locations, and the orientation of their processes - ependymocyte have cilia in the ventricle and tanycytes have basal processes in the brain parenchyma and median eminence (B) Marker gene expression shown by ependymal cell feature plot (top) and in situ hybridization of coronal brain sections (Allen Mouse Brain Atlas; bottom). Ependymal cell feature plot derived from tSNE plot shown in Figure 1B. Genes were selected from those differentially expressed among ependymal cell clusters. (C) Annotation of ependymal cell clusters based on anatomical localization of marker genes. Figure was derived from tSNE plot shown in Figure 1B (thumbnail). (D) Heatmap of single-cell expression of cluster-enriched transcripts. (E) Top left, ependymal cell feature plot re-colored to indicate cells with any amount of Sprr1a transcript. Top right, Sprr1a in situ hybridization in a coronal brain section (Allen Mouse Brain Atlas). Bottom left, schematic of an experiment to define the diffusion barrier between Arc and ME. Bottom right, confocal micrograph comparing SPRR1A immunoreactivity to the location of the Arc/ME diffusion barrier, visualized by extravasation of intravascular Evan’s Blue; micrograph is representative of 2 mice.

