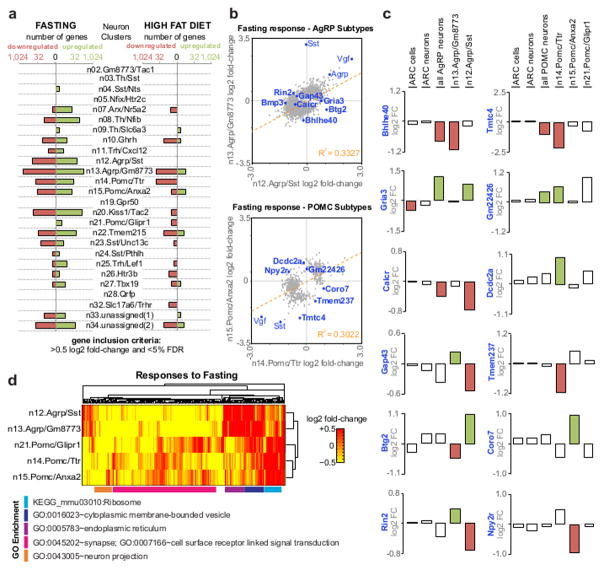
Figure 7. Transcriptional responses to energy imbalance.
(A) Histograms showing the number of genes significantly up- or down-regulated in response to fasting and high fat diet in each Arc-ME neuron subtype. (B) Comparison of fasting responses of AgRP neuron subtypes (top) and POMC neuron subtypes (bottom). Genes plotted were significantly affected by fasting (false-discovery rate (FDR), <0.25) in at least one AgRP neuron subtype (top) or POMC neuron subtype (bottom). While subtypes generally show significant correlation (R2 = 0.33 for AgRP neuron subtypes and R2 = 0.30 for POMC neuron subtypes), there are many individual genes that are differentially affected by fasting (e.g., within top-left and bottom-right quadrants). (C) Examples of genes affected by fasting only in one subtype of AgRP neurons and POMC neurons, or affected oppositely between subtypes. For comparison, average fold-change values are also shown for all Arc-ME cells, all Arc-ME neurons, and all AgRP or POMC neurons. Bars are shaded to indicate the gene was differentially expressed at FDR<0.25 (D) Heatmap of gene expression fold-change values for genes significantly affected in at least one AgRP or POMC subtype. Genes are clustered by gene expression similarities across AgRP and POMC subtypes. GO terms with highest significance for each cluster are shown.

