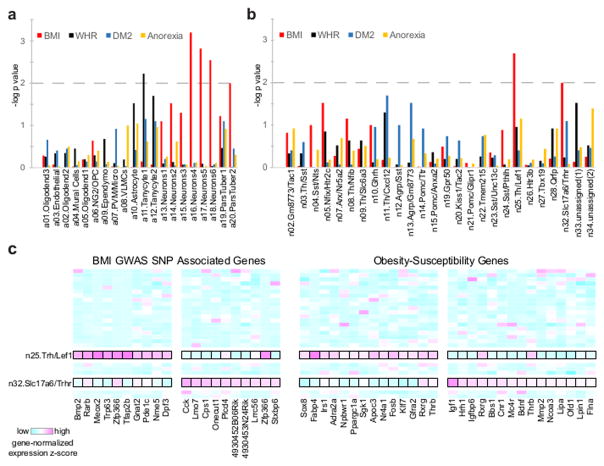
Figure 8. DEPICT predicts specific neuronal subtypes affecting BMI.
(A) DEPICT predicts transcripts from BMI-associated loci (p < 3×10⁻³), but not WHR, DM2, or anorexia-linked loci, are enriched in neurons. The dotted line shows statistically significant enrichment. (B) DEPICT predicts transcripts from BMI-associated loci (P < 1×10⁻²) are enriched in n25.Trh/Lef1 and n32.Slc17a6/Trhr neuron clusters. (C) Heatmap of n25.Trh/Lef1 and n32.Slc17a6/Trhr neuron cluster expression of genes near BMI-linked loci or related to obesity susceptibility.

