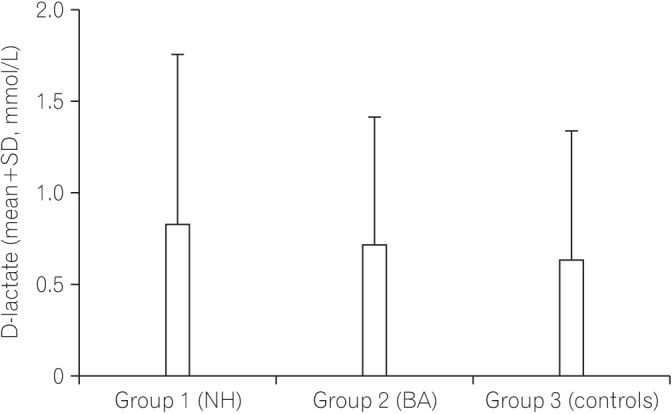
Fig. 3. Comparison of the serum level of D-lactate between infants with cholestasis and controls. P-value=0.65 for the NH group versus controls; P-value=0.36 for the BA group versus controls; P-value=0.66 for the NH group versus the BA group. NH, neonatal hepatitis; BA, biliary atresia.

