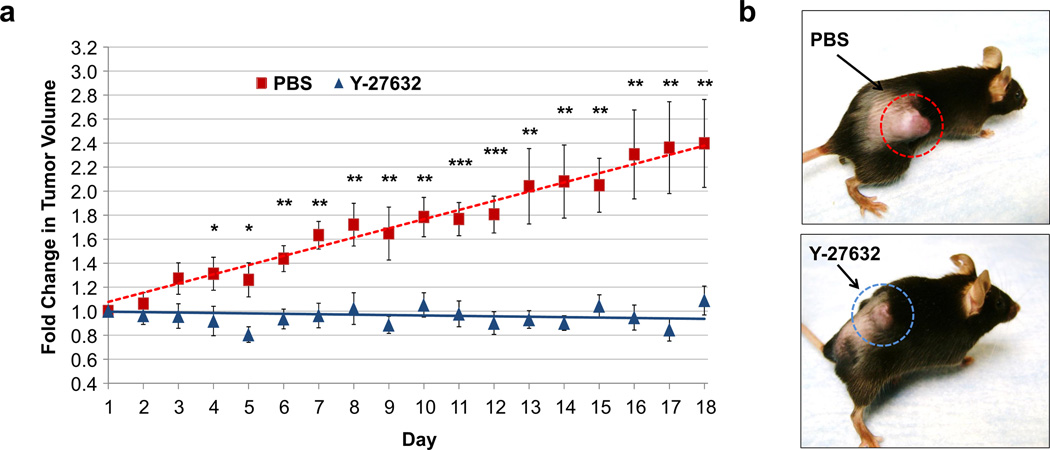
Figure 6. Y-27632 inhibits tumor growth in vivo.
(a) 5 × 10⁶ 786-OT1 cells were injected into the right flank of 18 NOG mice. After one month, mice were randomized into two groups. Mice were treated daily with PBS vehicle (n = 9) or 10 mg/kg Y-27632 (n = 9) by ip injection. The fold change in tumor volume was analyzed statistically using a One-way ANOVA with treatment as the factor (*p < 0.05, **p < 0.01, ***p < 0.005), SEMs are shown. The solid line represents the linear trend fit of the data for each treatment group. (b) Representative images of a control mouse (top) and a Y-27632-treated mouse (bottom) on day 14 of treatment are shown.

