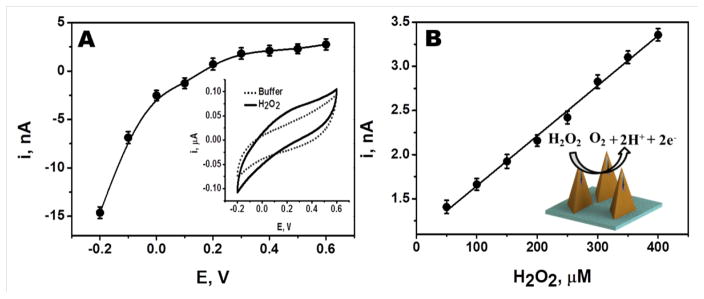
Figure 2.
(A) Effect of applied potential (−0.2 V to 0.6 V) on the chronoamperometric responses of 250 μM H2O2 measured at Pt wire integrated microneedle electrode. Also shown (inset) the corresponding cyclic voltammogram for 500 μM H2O2. (B) Linear chronoamperometric responses of H2O2 (50 μM to 400 μM) measured at Pt wire integrated microneedle electrode (inset shows the oxidation of H2O2 on the Pt wire integrated microneedle electrode).

