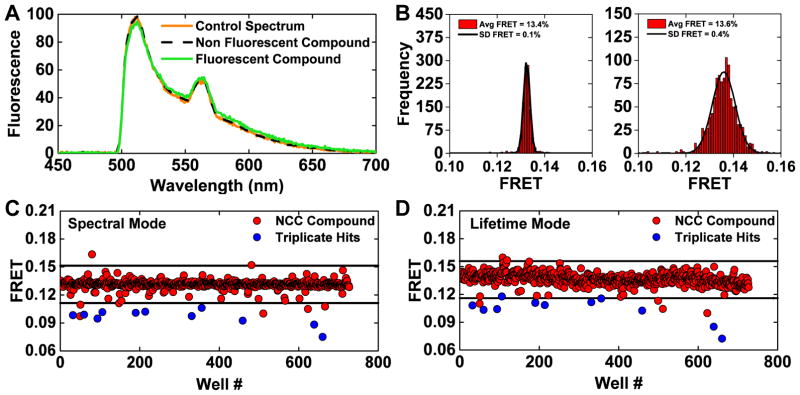
Figure 3.
(A) Fluorescence emission spectra were used to identify and flag potential interference from fluorescent compounds by assessing the similarity index (Eq. 1) of each well from a pilot screen of the NCC1 & 2 small-molecule libraries. A control spectrum (%v/v DMSO well) and non-fluorescent (compound not identified as a FRET hit during screening with 2CS) have a high degree of similarity, as shown as direct overlap of orange and black spectrum. A slightly fluorescent compound is depicted by the green spectrum and was flagged as a potential false-positive hit. The fluorescent profile of all 1152 wells from one NCC screen was assessed using a stringent similarity index threshold; 44 compounds were flagged as potential false-positives due to interference from compound fluorescence. (B) Histogram plots of the wells from one NCC screen after removing potential fluorescent compounds. Gaussian fits depict an increase in precision from spectral mode (left) in comparison to lifetime mode (right), shown as the frequency of FRET efficiency determined by either method and a narrower distribution from spectral mode (average FRET calculated by spectral unmixing or lifetime and the standard deviation determined from the Gaussian fit). (C) One 2CS pilot NCC screen (spectral mode) is shown with a hit threshold set at a 0.02 change in 2CS FRET (4 SD). 16 FRET hits were identified in this screen. 11 of these 2CS FRET hits were found to be reproducible across three independent screens (blue). (D) The same 384-well plates were scanned in lifetime mode. 16 hits were identified using the same threshold set at a 0.02 change in 2CS FRET efficiency (3 SD). In this screen, nine of the reproducible 2CS FRET hits identified in spectral mode were also FRET hits as assessed by lifetime mode (blue).

