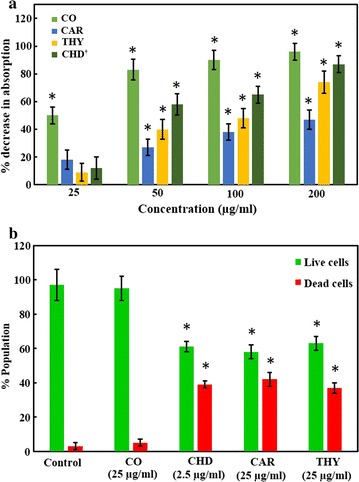
Fig. 3.

The change in the viability of S. mutans when grown with clove oil (CO), carvacrol (M-1; CAR), thymol (M-2; THY), and chlorhexidine digluconate (CHD). a Shows percent change in the metabolic activity of S. mutans using MTT assay with various concentrations of test compounds. While b shows the percent population of dead and live cells as determined by Live/dead staining when grown with test compounds. The experiment was done in triplicate and values are presented as mean ± S.D error. Asterisk represents the p value <0.05. Dagger the concentration of CHD is 2.5, 5, 10 and 20 µg/ml (refer to Additional file 1 for raw data)
