Figure 5.
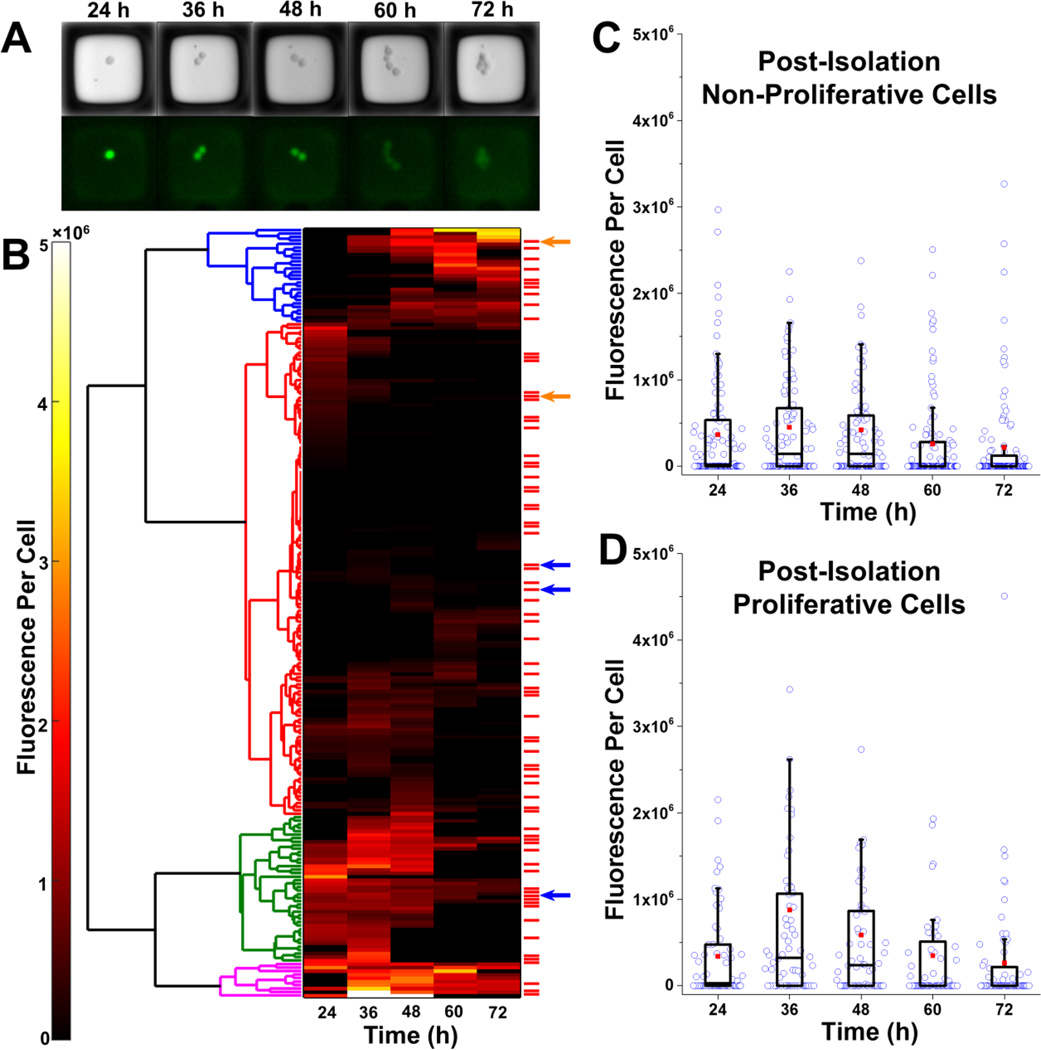
Selection and isolation of microrafts with cells. (A) Bright field and fluorescence microscopy images for a single microraft at 24–72 h post-transfection. This microraft possessed cells that were correctly gene-edited with the S34F mutation (clone 2). (B) Hierarchical clustering was performed (left) on the mean fluorescence per cell for each of the 220 microrafts possessing EGFP+ cells at any time point. Four main clusters were identified. These clusters roughly corresponded to low fluorescence for the entire duration (red), high fluorescence for the entire duration (magenta), low expression followed by high expression (blue), and high expression followed by low expression (green). The red bars to the right of the heat map mark microrafts with cells that proliferated post-isolation. Arrows represent microrafts that contained cells that were missing the restriction enzyme site within the U2AF1 gene, indicating that a mutation had been introduced in the U2AF1 gene during repair of a Cas9-induced DSB. Blue arrows represent microrafts containing cells that were altered by HDR. (C–D) Box plots showing the fluorescence per cell over time for microrafts with cells that did not (C) or did (D) proliferate after microraft isolation. The fluorescence per cell at identical time points was compared for the proliferative and non-proliferative groups using a Mann-Whitney U test. There was no statistically significant difference between the groups at any time point (all p>0.05).

