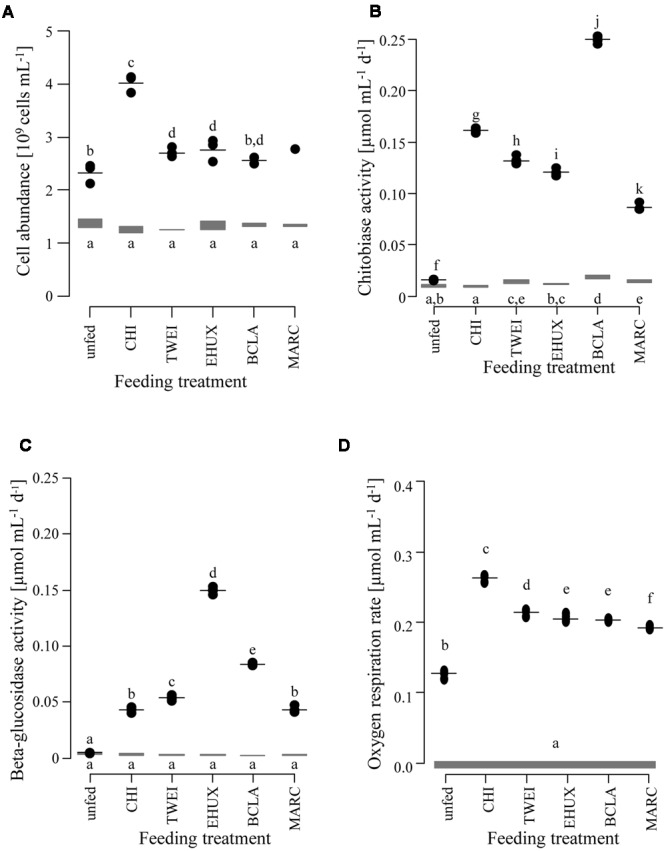
FIGURE 1.

Changes in cell abundance (A; n = 3), extracellular enzyme activity (B: chitobiase, C: beta-glucosidase; n = 5), and oxygen respiration rates (D; n = 5) of the sediment community in the different treatments under atmospheric pressure conditions. Gray bars show the range at the beginning of the incubation. Black dots show measurements after 23 days of incubation, with the horizontal black line indicating the mean value per treatment. Lower case letters indicate groups of treatments that are significantly different from each other based on Tukey HSD at a significance threshold of p < 0.05. Day 0: starting conditions, unfed: control sediments after 23 days of incubation, carbon amendments: chitin (CHI), Thalassiosira weissflogii (TWEI), Emiliania huxleyi (EHUX), Bacillaria sp. (BCLA), Melosira arctica (MARC). Only one measurement of cell abundance was available for MARC-treated sediment.
