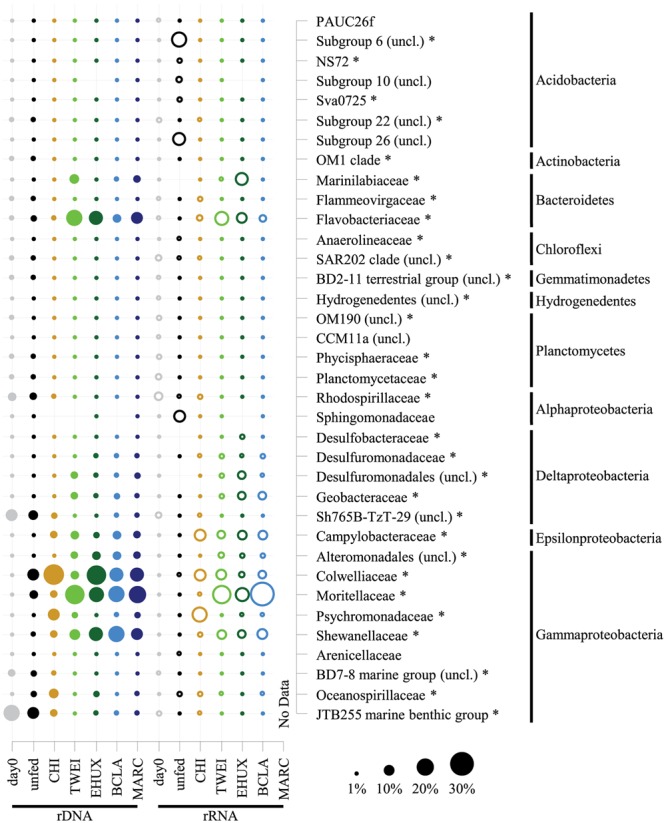
FIGURE 4.

Dot plot showing relative sequence abundances of dominant bacterial families, and their phylum affiliation, of the total (16S rDNA; n = 3) and active (16S rRNA; n = 1) bacterial community in the different sediment treatments under atmospheric pressure conditions. For the total bacterial community, sequences from replicate samples were pooled for the calculation of relative sequence abundances. For families of the Proteobacteria, class-level resolution is shown. For taxa that were unclassified at the respective level of resolution, the next higher taxonomic rank is shown. Asterisks mark differentially abundant taxa between treatments based on 16S rDNA samples (ALDEx2 analysis). All groups that are not marked by an asterisk were only abundant in 16S rRNA data, for which no replicates are available and therefore no analysis of differential abundance could be performed. Day 0: starting conditions, unfed: control sediments after 23 days of incubation, carbon amendments: chitin (CHI), Thalassiosira weissflogii (TWEI), Emiliania huxleyi (EHUX), Bacillaria sp. (BCLA), Melosira arctica (MARC). No rRNA data is available for MARC-treated sediment.
