Figure 1, A-G.
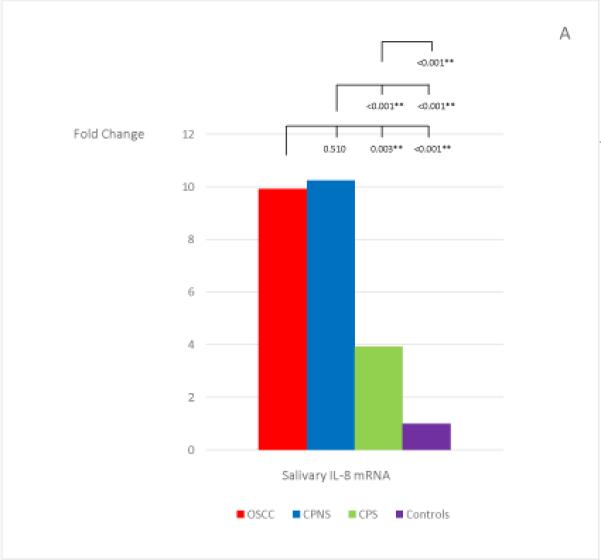
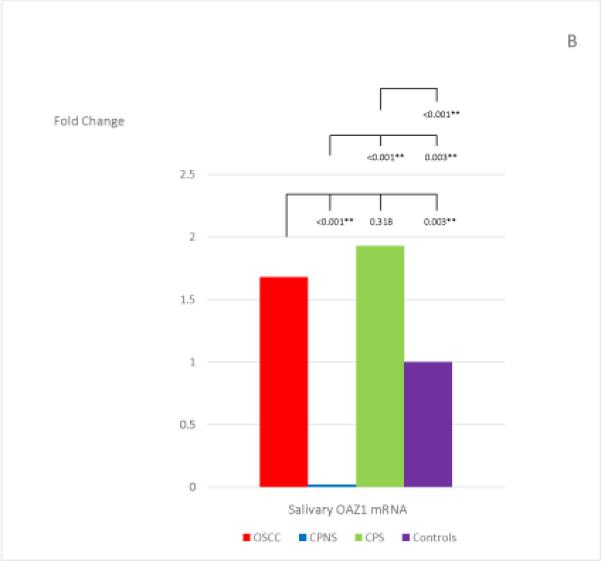
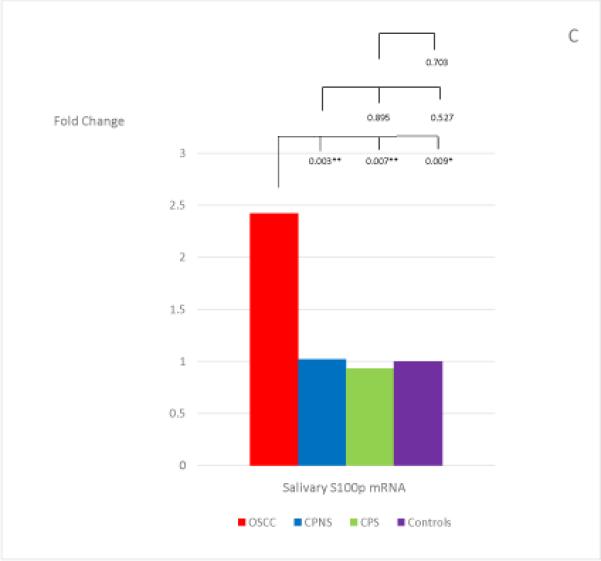
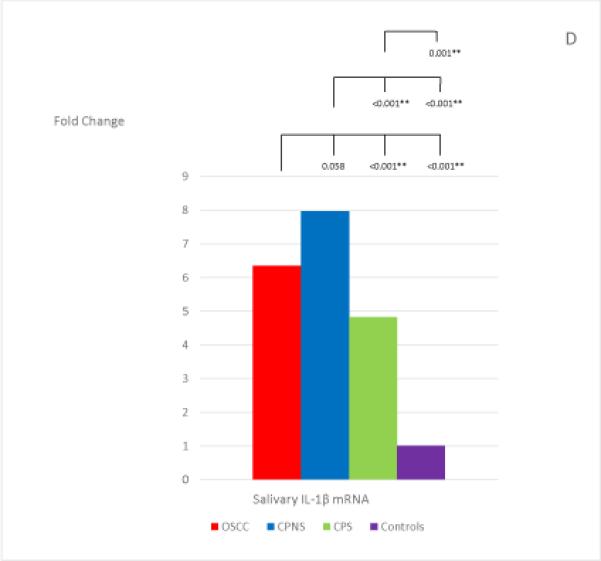
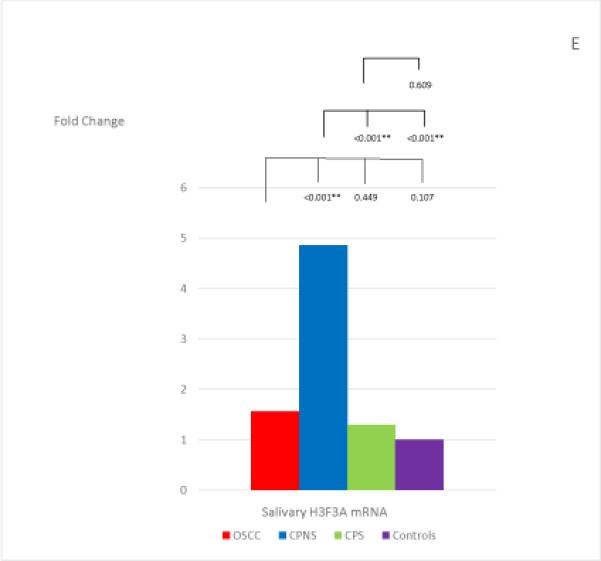
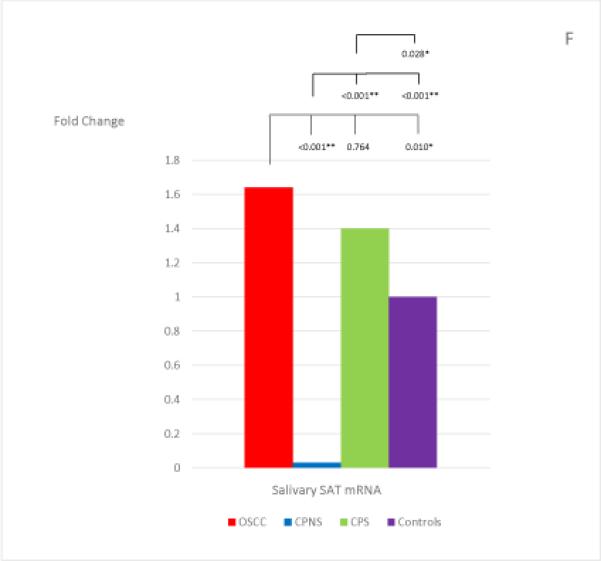
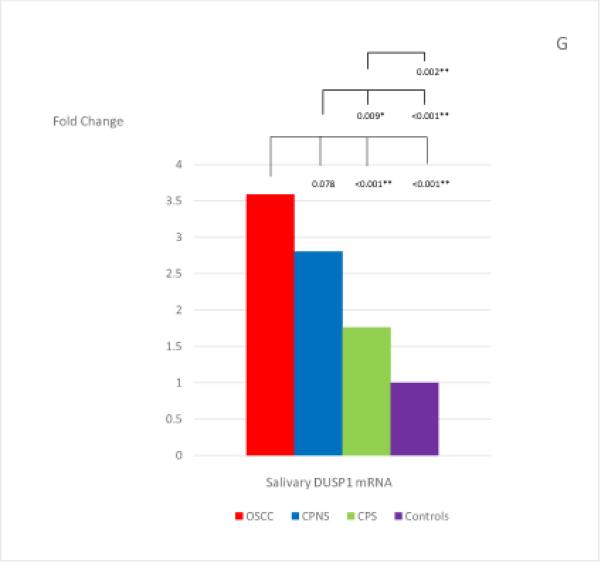
The mean fold changes of the 7 salivary mRNAs in each patient group when compared to the levels found in the Healthy Control group, and the statistical results for each pair of the study groups. Bracket with the p-value indicates the statistical result for each pair of study groups (“*” indicates marginal significance and “**” indicates statistical significance).
