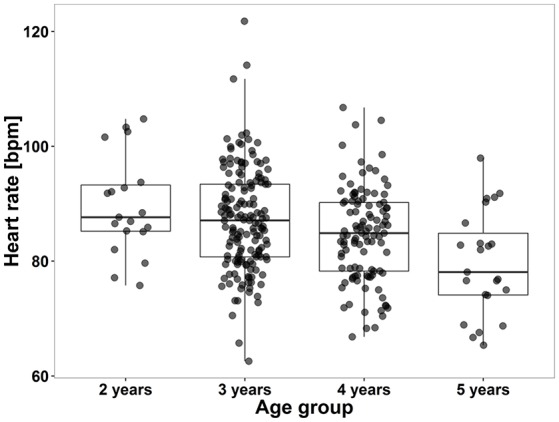
Figure 2.

Boxplot showing “deep sleep” heart rates of children according to their age. Box plots show group medians (solid line), IQR (box outline) and spread of data without outliers (whiskers) for each group. The spread of dots with regard to the x-axis reflects younger and older children within each age group. There was a significant difference according to Kruskal–Wallis testing between children aged 2 and 5 years (H = 17.8, p < 0.001). Parametric linear regression revealed a significant decline of heart rate with increasing age (r = −0.27, p < 0.001). Data are based on HRV data from the high %HF segments.
