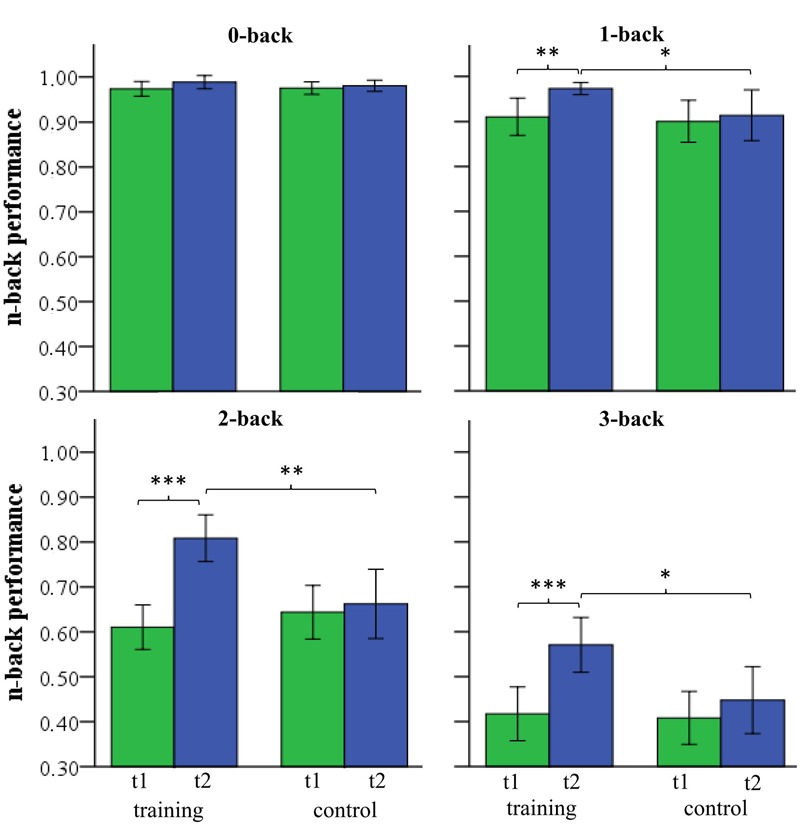
FIGURE 4.

n-back performance of the training and control group at pre-test (T1) and post-test (T2) for 0-, 1-, 2-, and 3-back (∗p < 0.05; ∗∗p < 0.01; ∗∗∗p < 0.001).

n-back performance of the training and control group at pre-test (T1) and post-test (T2) for 0-, 1-, 2-, and 3-back (∗p < 0.05; ∗∗p < 0.01; ∗∗∗p < 0.001).